Investment Insights Home Page
Why International Securities?
February 16, 2021
By: J. Reed Murphy, CIO
Contributions by: Rob Young, CFA
Bias. As the famous author, Malcolm Gladwell, has so eloquently illustrated in many of his writings, perhaps none so profoundly as Blink: The Power of Thinking Without Thinking, humans are prone to biases.
Gladwell has an insightful way of illustrating how the mind works psychologically in cultural, social and economic settings. His insights are a practical and broader application of what several Nobel Laureates have illustrated in behavioral economics and finance. People have biases and it impacts our decisions.
This paper highlights one of the more popular biases in behavioral economics – Familiarity Bias. The avoidance of investments that we either don’t understand or are less familiar with is a classic form of familiarity or home bias. It exists within all humans and in all countries.
This paper highlights one of the more popular biases I behavioral economics – Familiarity Bias. The avoidance of investments that we either don’t understand or are less familiar with is a classic form of familiarity or home bias. It exists within all humans and in all countries. We’d like to dispel this thought process and highlight that, for a number of reasons, most investors should carry a core position in international securities. In this paper, we will answer the following key questions:
- How does the U.S. compare to the rest of the world?
- Why a binary comparison of domestic stocks vs. all other international stocks as a group is flawed and misleading?
- How should one approach international investing?
How does the U.S. compare to the rest of the world?
There are several fundamental issues to consider before making an emotional decision to avoid international equities based on familiarity bias. There are numerous fundamentals to consider that paint the broader context for investing. Consider the following.
The U.S. only represents 4% of world’s population, 10% of the world’s publicly traded companies, 24% of world’s economy, and 57% of its total stock market. However, as shown in Exhibit 1 U.S. investors allocate a disproportionate 75% of their overall equity allocation to the U.S. Not including international investment opportunities dramatically reduces the opportunity set for successful investing.
Exhibit 1: U.S. Investors Show Home Bias despite More Opportunities Elsewhere
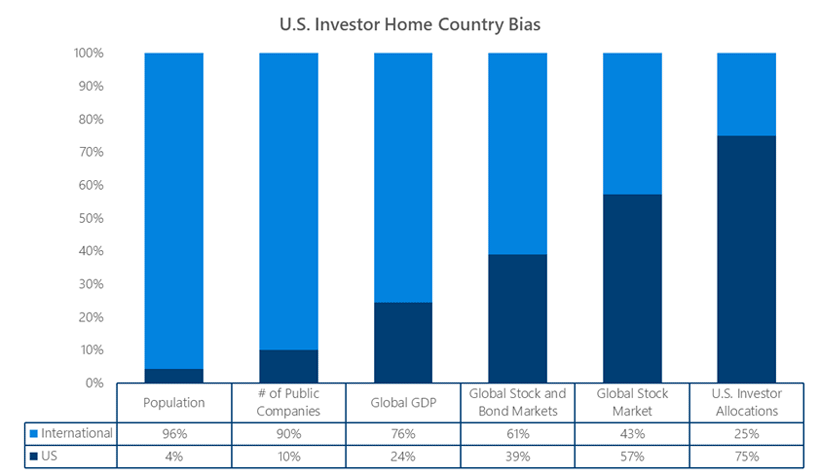
Source: Bloomberg, JP Morgan, Morningstar; As of Date: Population: (2017), # of Public Companies (2018), Global GDP (2019), Global Stock and Bond Markets (2019), Global Stock Market (2020) U.S. Investor Allocations (2020)
Why Is the Comparing of a Group of U.S. Stocks to a Group of All Other International Stocks Misleading?
The most common pitfall investors make is comparing the U.S. market as a group to all other international stocks as a group. In making this binary comparison, one is generally comparing the S&P 500 (considered generally representative of U.S. equity market performance)) to the Morgan Stanley Capital International (MSCI) EAFE index of approximately 900 developed market companies or the MSCI Emerging Markets (EM) index of over 1,350 companies. This comparison is fraught with shortcomings, some of which we will explore. Our team dissects these shortcomings from a top-down perspective, starting with countries, sectors and individual companies.
REASON 1: Country Performance Gets Lost In Index Performance
The MSCI EAFE (developed countries) Index consists of 21 countries and the MSCI EM (emerging markets) Index consists of 27 countries each with different performance and volatility drivers. As we previously noted, the S&P 500 is representing just one country. In Exhibit 2, we use the S&P 500 as a proxy for United States security performance and compare it at the country level to other countries within the MSCI EAFE and EM indexes --- in general, since 1990, the U.S. tends to fall near the middle of international country performance. Said another way, an investor that solely uses domestic securities for their equity allocation, misses several international country standouts on an annual basis.
Exhibit 2: Several countries outperform the S&P 500 on an annual basis
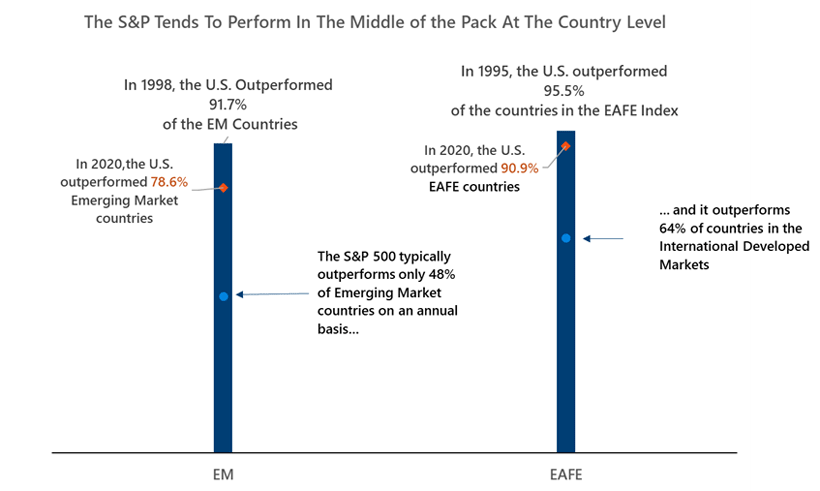
Source: Bloomberg, Data is from 12/31/1990 thru 12/31/2020. Past Performance Doesn’t Guarantee Future Results. S&P is represented by the S&P 500 Index, EM, is represented by the MSCI EM Index and EAFE is represented by the MSCI EAFE Index. The S&P 500 is considered generally representative of U.S. equity market performance. MSCI Emerging Markets Index is an index used to measure equity market performance in global emerging markets. The MSCI EAFE captures the performance of large- and mid-capitalization companies in the Europe, Australasia and the Far East (EAFE) regions.
REASON 2: Sector Weighting Differences Are Significant
When comparing the sector weightings of the U.S. in a global stock market index at the economic sector level, the S&P 500 has greater exposure to Information Technology, Healthcare and Communication Services, which over the last decade has seen the strongest performance. International indices tend to be levered to the material, financial and energy sectors, which have seen poorer relative performance (Exhibit 3) in recent years.
Exhibit 3: Sector Weights Vary Between International and U.S. Markets
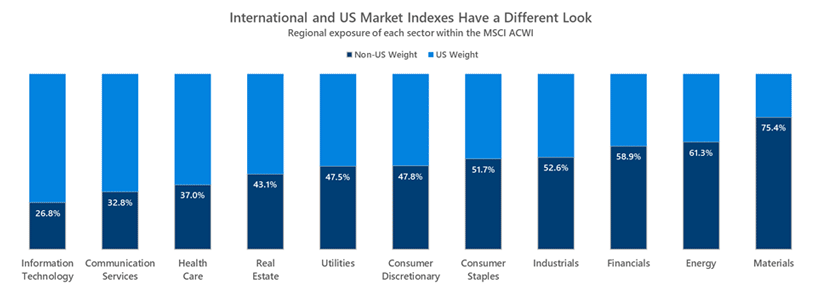
Source: MSCI, RIMES, Calamos Wealth Management. As of 12/31/20. MSCI ACWI is represented by the MSCI ACWI Index
As we evaluate the actual performance of economic sectors within a global context, we note that the actual performance differences can also be significant. Over the last 20 years (ending November 2019, the average annual sector performance dispersion was 3.6%. The Consumer Staples and Materials sectors were fairly tight, but the performance difference within Energy, Financials and Technology was region dependent (Exhibit 4).
Exhibit 4: Sector Performance Depends On Region
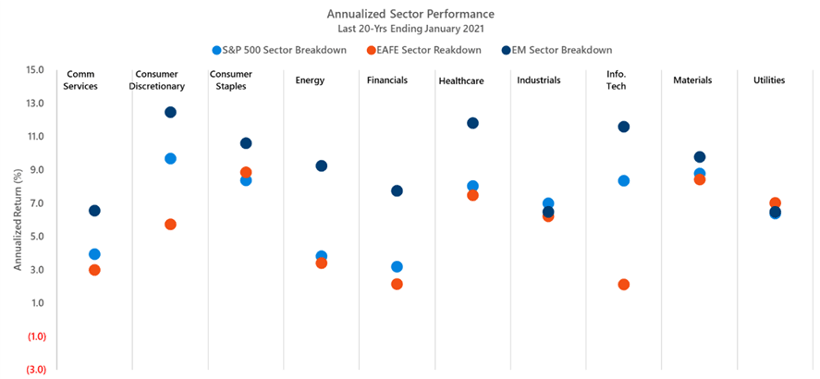
Source: Bloomberg. Data as of 1/31/21. Past Performance Doesn’t Guarantee Future Results. Note: REITS were excluded due to lack of availability for the S&P 500 or EAFE Indexes; S&P 500 is represented by the S&P 500 Index; EAFE is represented by the MSCI EAFE Index, EM is represented by the MSCI EM Index
REASON 3: Some of the Best Companies and Stock Performers are NOT in the U.S.
To further drive the point, according to The World Bank, only 10% of the global stock universe is domiciled in the U.S. Not opening one’s tool box to international companies significantly restricts one’s exposure to some of the best companies and business models in the world. For example (Exhibit 5), Royal Dutch Shell, based in the Netherlands, is the 3rd largest company in the world based on 2018 revenues. Volkswagen, the largest global auto company, is nearly 2x the size of General Motors. Alibaba, a technology and commerce giant, is a Chinese company. Over the last three years Alibaba has grown its revenue at a 55% CAGR versus a ~30% CAGR for Amazon. Nestle is a Swiss company that is nearly 10x the size of Hershey. According to Bloomberg, Novartis represents an uncorrelated option for pharmaceutical investors and while BNP isn’t as large as J.P. Morgan by market cap, its dividend yield is nearly twice as large.
Exhibit 5: International Companies versus Their U.S. Competitors
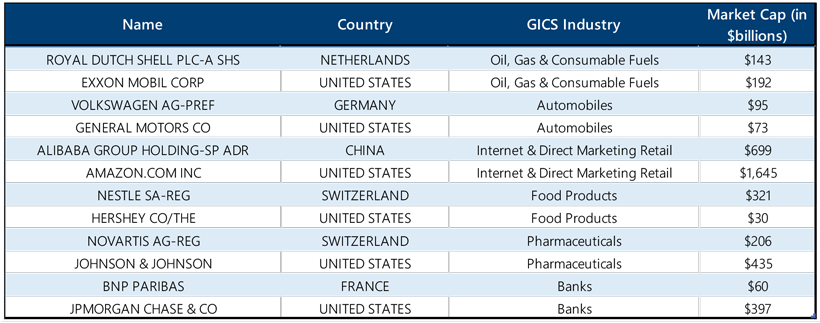
Source: Bloomberg; data as of 12/31/20 References to specific securities, asset classes and financial markets are for illustrative purposes only and are not intended to be, and should not be interpreted as, recommendations
From a stock performance perspective, the top 50 performing companies on an annual basis since 2009 have generally been foreign companies. On average only 25% of the top 50 stocks annually were U.S. based (Exhibit 6). As a result, if an investor was U.S. based only, they missed some of the best companies and investment opportunities in the world.
Exhibit 6: Top Performers Generally Reside outside the U.S.
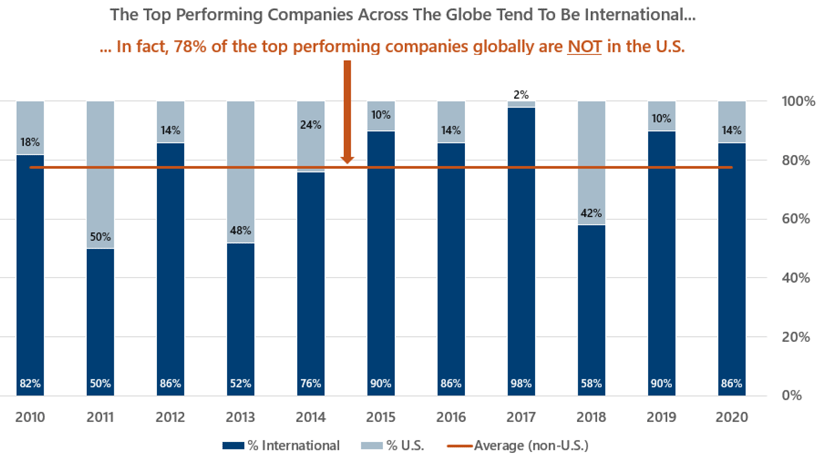
Source: MSCI, RIMES. 2019 as of 12/31/20. Past Performance Doesn’t Guarantee Future Results. Returns in US Dollars. Top 50 stocks are the companies with the highest total return in the MSCI ACWI each year. ACWI is represented by the MSCI ACWI Index.
How Should One Approach International Investing?
Investing should not be commoditized down to a game of winning or losing. That begs the question – winning or losing relative to what? The decision to include non-U.S. companies should be based on fundamentals and one’s goals.
Goals based Investing Supports More Tools in the Toolbox
Investing should be client-centered. That is, investing should be goals based. Considering international equities as part of one’s allocations simply brings more tools into the tool box to help one achieve a desired behavior and outcome. After all, one would not expect a carpenter to only use a hammer and nails to build a home. As we have demonstrated, considering international investments theoretically adds 90% of global companies back into the toolbox.
Active or Passive Considerations
While investible indexes are not available for all asset classes, they do exist for broad international markets. Actual investments in international companies can be obtained through passive (i.e., index) approaches or through active management (i.e., picking specific companies) approaches. International markets are certainly less efficient than the domestic large cap market, which further reinforces the point that deciding to invest in U.S. vs. non-U.S. markets should not be based on a binary comparison of stock indices.
Moreover, when indexing you are set to achieve the same returns (ex-fees), same level of volatility and the same yield as a given index. Not all investors want or need these same behaviors. For those that do desire a higher level of yield, then investing in international markets even through an index can provide higher dividend yield levels than in the U.S. (S&P 500 index). Furthermore, as exhibit 7 illustrates there are far more companies that have dividend yields greater than 3%. As of November 30th, 2019, there were 1,022 companies with dividend yields of 3% or more – 87% of those came from foreign companies. In a low interest rate environment, this is an important additional perspective.
Exhibit 7: International Companies Provide More Higher Yielding Opportunities
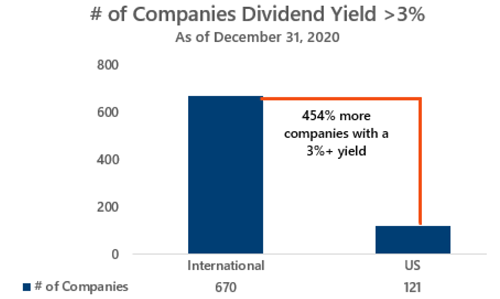
Sources: Bloomberg. Data as of 12/31/20. Regions represented by MSCI USA ETF (Ticker used: EUSA), MSCI World ex USA ETF (Ticker Used: ACWX) and MSCI Emerging Markets ETF (Ticker Used: EEM). iShares MSCI USA Equal Weighted ETF is an exchange-traded fund incorporated in the USA. The ETF seeks to track the investment results of an index Sources (continued): composed of equal weighted U.S. equities. iShares MSCI ACWI ex U.S. ETF is an exchange-traded fund incorporated in the USA. The ETF seeks investment results that correspond to the performance of the MSCI ACWI ex USA Index. The ETF seeks exposure to a broad range of international developed and emerging market companies. iShares MSCI Emerging Markets ETF is an exchange-traded fund incorporated in the USA. The ETF tracks the performance of the MSCI TR Emerging Markets Index. The ETF holds emerging market stocks that can predominantly be classified as large and mid-cap. It weights the holdings using a market capitalization methodology and rebalances quarterly.
Conclusion
While there are several other factors to consider when investing in international equity markets, the bigger picture suggests there are numerous more opportunities outside of the United States. Considering the allocation to international markets is not only a client-centric decision, but it should also be based on economic and market outlooks.
Being that the international universe is so large, comparing the U.S. to one index representing the entire international market is misleading. Some of the best international managers are picking from among the best countries, sectors and individual companies – all of which is lost when making a binary comparison of the S&P 500 to an international index like MSCI EAFE.
DEFINITIONS
MSCI EAFE: Index that is designed to measure the equity market performance of developed markets outside of the U.S. & Canada. It is maintained by MSCI Inc., a provider of investment decision support tools; the EAFE acronym stands for Europe, Australasia and Far East.
MSCI EM: Captures large and mid-cap representation across 26 Emerging Markets (EM) countries*. With 1,202 constituents, the index covers approximately 85% of the free float-adjusted market capitalization in each country. Emerging Market Equity consists of stocks issued by companies of non-US countries classified as either ‘emerging market’ or ‘frontier markets’ within the MSCI World Index or the MSCI Frontier Markets Index. In addition to the general risk of foreign investing, the securities markets of Emerging Markets are substantially smaller, less developed, less liquid, and more volatile than the securities of US and other more developed countries.
S&P 500: Widely regarded as the best single gauge of large-cap U.S. equities. There is over USD 9.9 trillion indexed or benchmarked to the index, with indexed assets comprising approximately USD 3.4 trillion of this total. The index includes 500 leading companies and covers approximately 80% of available market capitalization.
MSCI ACWI is a market capitalization weighted index designed to provide a broad measure of equity-market performance throughout the world. The MSCI ACWI is maintained by the Morgan Stanley Capital International (MSCI) and is comprised of stocks from 23 developed countries and 24 emerging markets. An emerging market economy is the economy of a developing nation that is becoming more engaged with global markets as it grows.;
MSCI Inc. is an investment research firm that provides indices, portfolio risk and performance analytics, and governance tools to institutional investors and hedge funds.
Compound annual growth rate (CAGR) is the rate of return that would be required for an investment to grow from its beginning balance to its ending balance, assuming the profits were reinvested at the end of each year of the investment’s lifespan
DISCLOSURE
Past performance is not a guarantee or predictor of future results. Asset Allocation and Diversification does not guarantee a profit or protect against a loss. Capital market assumptions may be revised periodically, which can severely alter the results of different analyses. Calamos Wealth Management cannot give any assurances that these assumptions or any results relying upon these assumptions will prove correct. This information is not intended as a recommendation to invest in any particular asset class or as a promise of future performance. References to future returns are not promises or even estimates of actual returns a client portfolio may achieve and should not be relied upon as recommendations to buy or sell securities. Assumptions, opinions and estimates are provided for illustrative purposes only. Forecasts of financial market trends that are based on current market conditions constitute our judgement and are subject to change without notice.
Different types of investments involve varying degrees of risk, and there can be no assurance that the future performance of any specific investment, investment strategy, or product (including the investments and/or investment strategies recommended or undertaken by Calamos Wealth Management, LLC [“Calamos]), or any non-investment related content, made reference to directly or indirectly in this commentary will be profitable, equal any corresponding indicated historical performance level(s), be suitable for your portfolio or individual situation, or prove successful. Due to various factors, including changing market conditions and/or applicable laws, the content may no longer be reflective of current opinions or positions. Moreover, you should not assume that any discussion or information contained in this commentary serves as the receipt of, or as a substitute for, personalized investment advice from Calamos. Please remember to contact Calamos, in writing, if there are any changes in your personal/financial situation or investment objectives for the purpose of reviewing/evaluating/revising our previous recommendations and/or services, or if you would like to impose, add, or to modify any reasonable restrictions to our investment advisory services. Unless, and until, you notify us, in writing, to the contrary, we shall continue to provide services as we do currently. Calamos is neither a law firm, nor a certified public accounting firm, and no portion of the commentary content should be construed as legal or accounting advice. A copy of the Calamos’ current written disclosure Brochure discussing our advisory services and fees continues to remain available upon request or at www.calamos.com.
Opinions and estimates offered constitute our judgment and are subject to change without notice, as are statements of financial market trends, which are based on current market conditions. We believe the information provided here is reliable, but do not warrant its accuracy or completeness. This material is not intended as an offer or solicitation for the purchase or sale of any financial instrument. The views and strategies described may not be suitable for all investors. The opinions and views of third parties do not represent the opinions or views of Calamos Wealth Management LLC. Opinions referenced are as of the date of publication and are subject to change due to changes in the market, economic conditions or changes in the legal and/or regulatory environment and may not necessarily come to pass. This information is provided for informational purposes only and should not be considered tax, legal, or investment advice. References to specific securities, asset classes and financial markets are for illustrative purposes only and are not intended to be, and should not be interpreted as, recommendations
Historical performance results for investment indices, benchmarks, and/or categories have been provided for general informational/comparison purposes only, and generally do not reflect the deduction of transaction and/or custodial charges, the deduction of an investment management fee, nor the impact of taxes, the incurrence of which would have the effect of decreasing historical performance results. It should not be assumed that your Calamos account holdings correspond directly to any comparative indices or categories. Please Also Note: (1) performance results do not reflect the impact of taxes; (2) comparative benchmarks/indices may be more or less volatile than your Calamos accounts; and, (3) a description of each comparative benchmark/index is available upon request.
Neither rankings and/or recognitions by unaffiliated rating services, publications, media, or other organizations, nor the achievement of any professional designation, certification, degree, or license, or any amount of prior experience or success, should be construed by a client or prospective client as a guarantee that he/she will experience a certain level of results if Calamos is engaged, or continues to be engaged, to provide investment advisory services. Rankings published by magazines, and others, generally base their selections exclusively on information prepared and/or submitted by the recognized adviser. Rankings are generally limited to participating advisers. Unless expressly indicated to the contrary, Calamos did not pay a fee to be included on any such ranking. No ranking or recognition should be construed as a current or past endorsement of Calamos by any of its clients.
© 2021 Calamos Wealth Management. All Rights Reserved. Calamos® and Calamos Investments® are registered trademarks of Calamos Investments LLC.
6822_1219_CWM_Rev. 2/21