Investment Insights Home Page
Quarterly Market Commentary
Q3 2023
October 10, 2023
A September swoon gripped markets as investor sentiment turned sour because of several risks to the market. These risks included a higher-for-longer rate environment, the resumption of student loan payments, surging oil prices, and labor strikes.
The S&P 500 is off over 6% from its high on July 31, whereas US 10-year treasury yields continue to march higher, having increased by nearly 1% over the past three months. The backup in yields appears to be driven by an expectation of a higher-for-longer approach from the Fed, stronger economic data, and concerns around debt sustainability.
Below, we identify three key themes that we expect to heavily influence markets in the coming quarter:
- Fed Thread (The Needle)?
- Consumer Saves the Day?
- Macro Risks Return
Fed Thread (The Needle)?
As widely expected, the Federal Reserve paused rate hikes at its September meeting. Investors focused closely on the refreshed dot plot and updated economic expectations. The dot plot showed the likelihood of one more increase this year with two cuts to follow in 2024. Investors again pushed out expectations for rate cuts during the quarter.
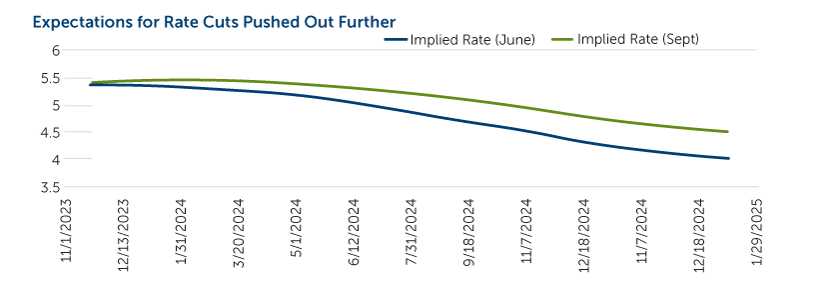
Source: Bloomberg, Chicago Board of Trade
Officials became more optimistic about economic growth for both this and the next year while lowering their expectation for inflation. In his press conference following the announcement, Powell noted that the Fed would proceed carefully with future rate decisions. A majority of the committee believes that the most likely outcome is one more hike. If this does happen, December seems more likely than November. One clear message from both the statement and press conference is the theme of “higher for longer.”
Picking the peak in rates is extremely difficult, though it is approaching. Investors with a long-term view may consider looking to add high-quality fixed income to their portfolios on both the public and private sides.
Can Consumers Continue to Save the Day?
As we’ve noted in our previous commentaries, US economic data have surprised us to the upside this year, driven heavily by resilient consumers. Much of the consumption strength has been the result of spending down savings accumulated during the pandemic. This impact appears to be near its end as the Federal Reserve Bank of San Francisco estimates that the accumulated pandemic savings will likely be fully spent by the end of this year. Excess savings have already been depleted for the bottom 80% of households, as can be seen in the chart below.
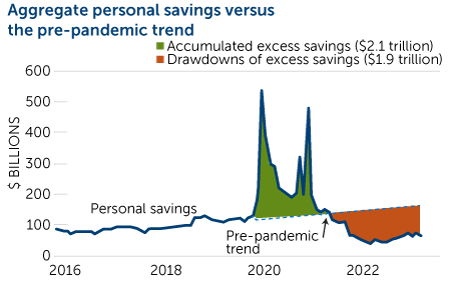
Source: Bureau of Economic Analysis and author's calculations.
Additionally, the resumption of student loan payments on October 1 adds to the downside risk to the consumer, impacting around 40 million borrowers with the typical federal student loan bill at $350 per month. Although both the wind down of accumulated savings and the upsurge in student loan payments will negatively impact consumer spending, employment and wage growth remain robust. Unemployment rates continue to trend near cycle lows, and the latest wage growth figures show an increase of 4.3% relative to a year ago.
Although we recognize these risks to consumer spending, we remain positive regarding the US consumer until we see a significant pickup in the unemployment rate.
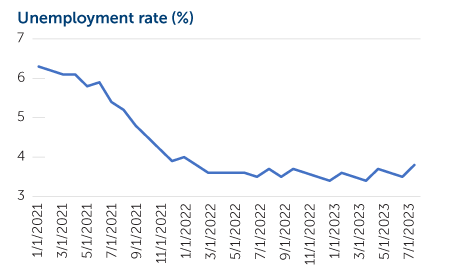
Source: Bureau of Labor Statistics, Bloomberg
Wage growth remains strong, and consumers are continuing to spend on services, vacations, and experiences.
Return of Macro-Risks
It has been fascinating to watch the changes to the consensus economic narrative in 2023. We came into the year with most economic forecasters looking for a recession, albeit a mild one, later in the year. As economic data continued strong in the first half of the year, that narrative shifted to calls for a soft landing even among some prominent bears. Just as the soft-landing narrative became widespread, a handful of macro risks reared their head and made investors more cautious toward the end of the third quarter.
The surge in crude oil prices in late August and early September is one of those macro risks. Oil prices remained in a tight range for the middle part of the year before jumping nearly 20% on production cuts by Saudi Arabia and Russia as well as increased demand.
We saw a significant pickup in labor strikes during the quarter, driven by declining real wages due to the recent pickup in inflation. Auto workers were joined by health-care workers in recent strikes. This is in addition to the Teamsters Union’s recently securing a significant increase in pay over the next six years. As the public’s support for unions has increased, we may see further labor disputes in the coming months.
Reflecting these macro risks, the big surprise for the quarter was the rapid increase in longer-term bond yields. While the yield curve remains inverted (we actually reached the longest yield curve inversion ever this year), it narrowed sharply during the quarter, reflecting the expectations that rates will remain higher for longer.
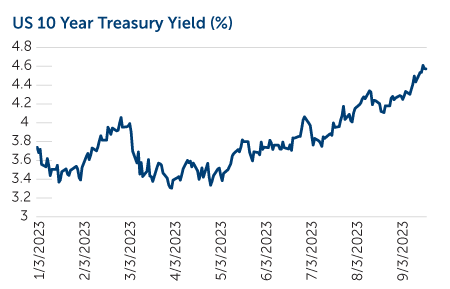
Source: Bloomberg as of 9/30/23
Adding to these risks was a potential government shutdown that we wrote about in a special market update. Thankfully, cooler heads prevailed, and Congress passed a stop bill to avert a shutdown.
Conclusion
The selloff in equities and increase in bond yields over the last couple of months illustrates the need for investors to remain diversified. In particular, we have found significant opportunities in private alternatives, which tend to have a lower correlation with traditional assets. Additionally, we use many risk-mitigation strategies in our portfolios that can provide downside protection while participating in much of the upside.
S&P 500 Index
The S&P 500® is widely regarded as the best single gauge of large-cap US equities and serves as the foundation of a wide range of investment products. The index includes 500 leading companies and captures approximately 80% coverage of available market capitalization.
Russell 2000 Index
The Russell 2000 Index is comprised of the smallest 2,000 companies in the Russell 3000 Index, representing approximately 8% of the Russell 3000 total market capitalization.
Bloomberg Barclays Aggregate Index
The Bloomberg US Agg Index is a broad-based flagship benchmark that measures the investment grade, US dollar-denominated, fixed-rate taxable bond market. The index includes Treasuries, government-related and corporate securities, MBS (agency fixed-rate pass-throughs), and ABS and CMBS (agency and non-agency).
Gross Domestic Product
The gross domestic product (GDP) measures the final market value of all goods and services produced within a country. It is the most frequently used indicator of economic activity.
This material is distributed for informational purposes only. The information contained herein is based on internal research derived from various sources and does not purport to be statements of all material facts relating to the information mentioned and, while not guaranteed as to the accuracy or completeness, has been obtained from sources we believe to be reliable. Opinions, estimates, forecasts, and statements of financial market trends that are based on current market conditions constitute our judgment and are subject to change without notice. The views and strategies described may not be suitable for all investors. References to specific securities, asset classes, and financial markets are for illustrative purposes only and are not intended to be, and should not be interpreted as, recommendations. The opinions and views of third parties do not represent the opinions or views of Calamos Wealth Management LLC. Opinions referenced are as of the date of publication and are subject to change due to changes in the market, economic conditions, or changes in the legal and/or regulatory environment and may not necessarily come to pass. This information is provided for informational purposes only and should not be considered tax, legal, or investment advice.
Past performance may not be indicative of future results. Different types of investments involve varying degrees of risk. Therefore, it should not be assumed that the future performance of any specific investment or investment strategy (including the investments and/or investment strategies recommended and/or undertaken by Calamos Wealth Management, LLC [“Calamos”]), or any non-investment related services, will be profitable, equal any historical performance level(s), be suitable for your portfolio or individual situation, or prove successful. Calamos is neither a law firm nor a certified public accounting firm, and no portion of its services should be construed as legal or accounting advice. Moreover, you should not assume that any discussion or information contained in this document serves as the receipt of, or as a substitute for, personalized investment advice from Calamos. Please remember that it remains your responsibility to advise Calamos, in writing, if there are any changes in your personal/financial situation or investment objectives for the purpose of reviewing/evaluating/revising our previous recommendations and/or services or if you would like to impose, add, or to modify any reasonable restrictions to our investment advisory services. A copy of our current written disclosure Brochure discussing our advisory services and fees is available upon request or at wm.calamos.com.
Historical performance results for investment indices, benchmarks, and/or categories have been provided for general informational/comparison purposes only and generally do not reflect the deduction of transaction and/or custodial charges, the deduction of an investment management fee, nor the impact of taxes the incurrence of which would have the effect of decreasing historical performance results. It should not be assumed that your account holdings correspond directly to any comparative indices or categories. Please Also Note: (1) performance results do not reflect the impact of taxes, (2) comparative benchmarks/indices may be more or less volatile than your accounts, and (3) a description of each comparative benchmark/index is available upon request. Diversification and asset allocation does not guarantee a profit or protect against a loss.