

Investment Insights Home Page
Quarterly Market Commentary - Q2 2024
June 25, 2024
In our commentary for the first quarter of this year, we noted three key risks to markets: uncertainty around Fed policy, commercial real estate concerns, and geopolitical considerations. Despite these risks, markets have continued to perform well, and investors have become increasingly confident that economic growth remains strong (particularly in the US), earnings growth continues to come in solidly, and inflation is mostly under control.
The S&P 500 is up over 15 percent this year as of end of June, whereas the NASDAQ has rallied nearly 20 percent. However, the equal weighted S&P 500 is up only 4.3 percent, highlighting the concentration of returns in a handful of large technology stocks. Fixed income has had a more difficult first half, with the Bloomberg US Aggregate Index essentially flat, following a rally since early April on reduced fears of inflation.
Below, we touch on the outlook for the Fed (a theme that will likely be ongoing), continued economic and earnings strength, and, of course, considerations around the US election.
Preelection Rate Cut?
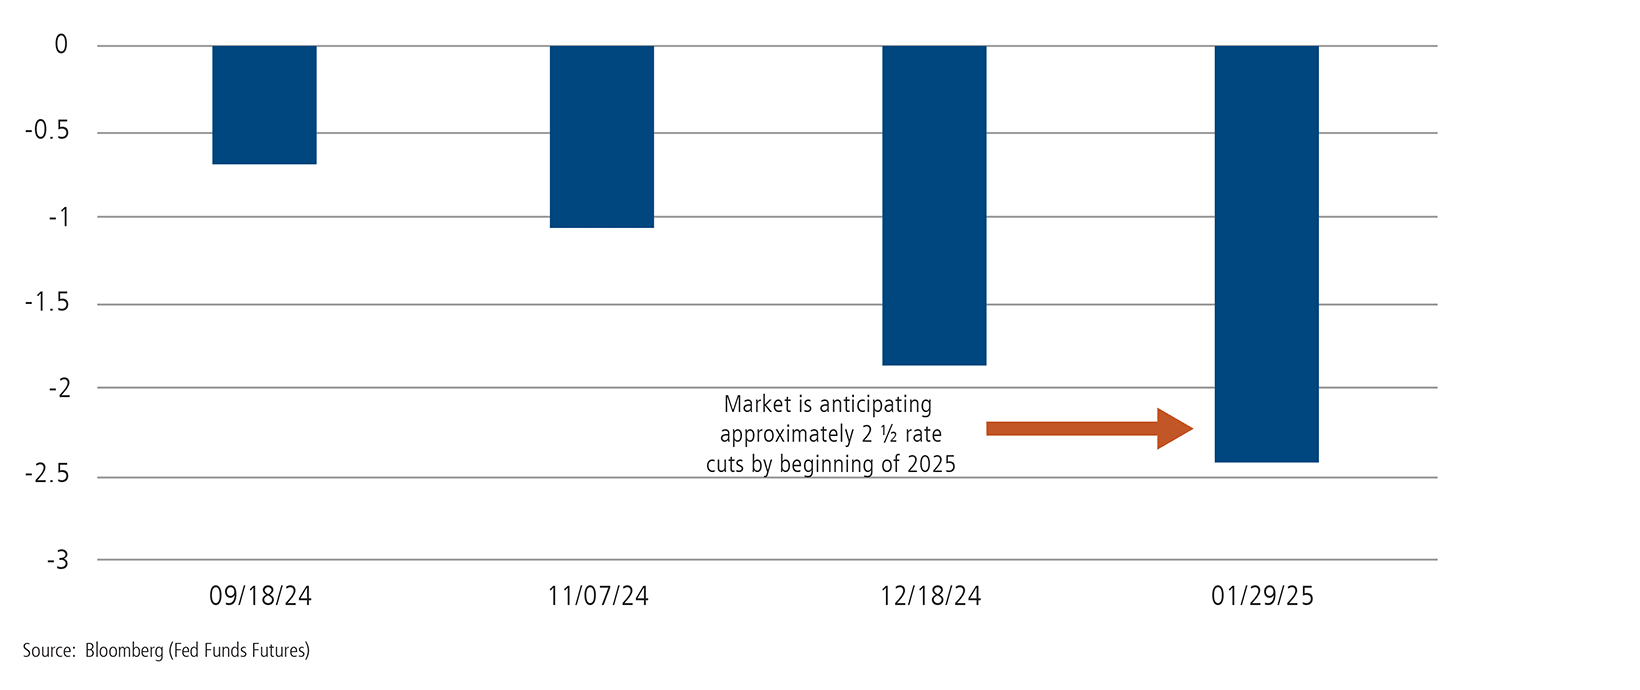
As we’ve highlighted previously, market expectations for potential rate cuts by the Federal Reserve have been on a roller-coaster ride throughout the year, fluctuating from six expected cuts coming into the year to as low as one cut at one point in the spring. The Fed’s expectation had been for three rate cuts this year (in line with markets for a brief time when we released our Q1 commentary). This outlook changed on June 12, when the median expectation in the Fed’s “dot plot” was updated to just one cut anticipated this year. For 2025, the Fed now sees four rate cuts, more than the three previously expected. However, Chair Powell was quick to note that markets shouldn’t “hold forecasts with high confidence.”
While inflation remains above the Fed’s 2% target, fears of a “second wave” of inflationary pressures have failed to materialize. Our view is that the Fed would like to get a rate cut in before the US election in November.
Market Pricing of Fed Cuts (# of cuts)
While the Fed typically leads major central bank interest rate cycles, the Bank of Canda (BOC) and European Central Bank (ECB) both cut rates before the Fed in June. The ECB is facing a different backdrop than the US due to Europe dealing with slow growth and weak consumer sentiment, as well as inflation that is closer to the Central Bank’s target. Similarly, the BOC has gained confidence that inflation is moving closer to target.
Continued Strength in the US Economy and Equity Earnings
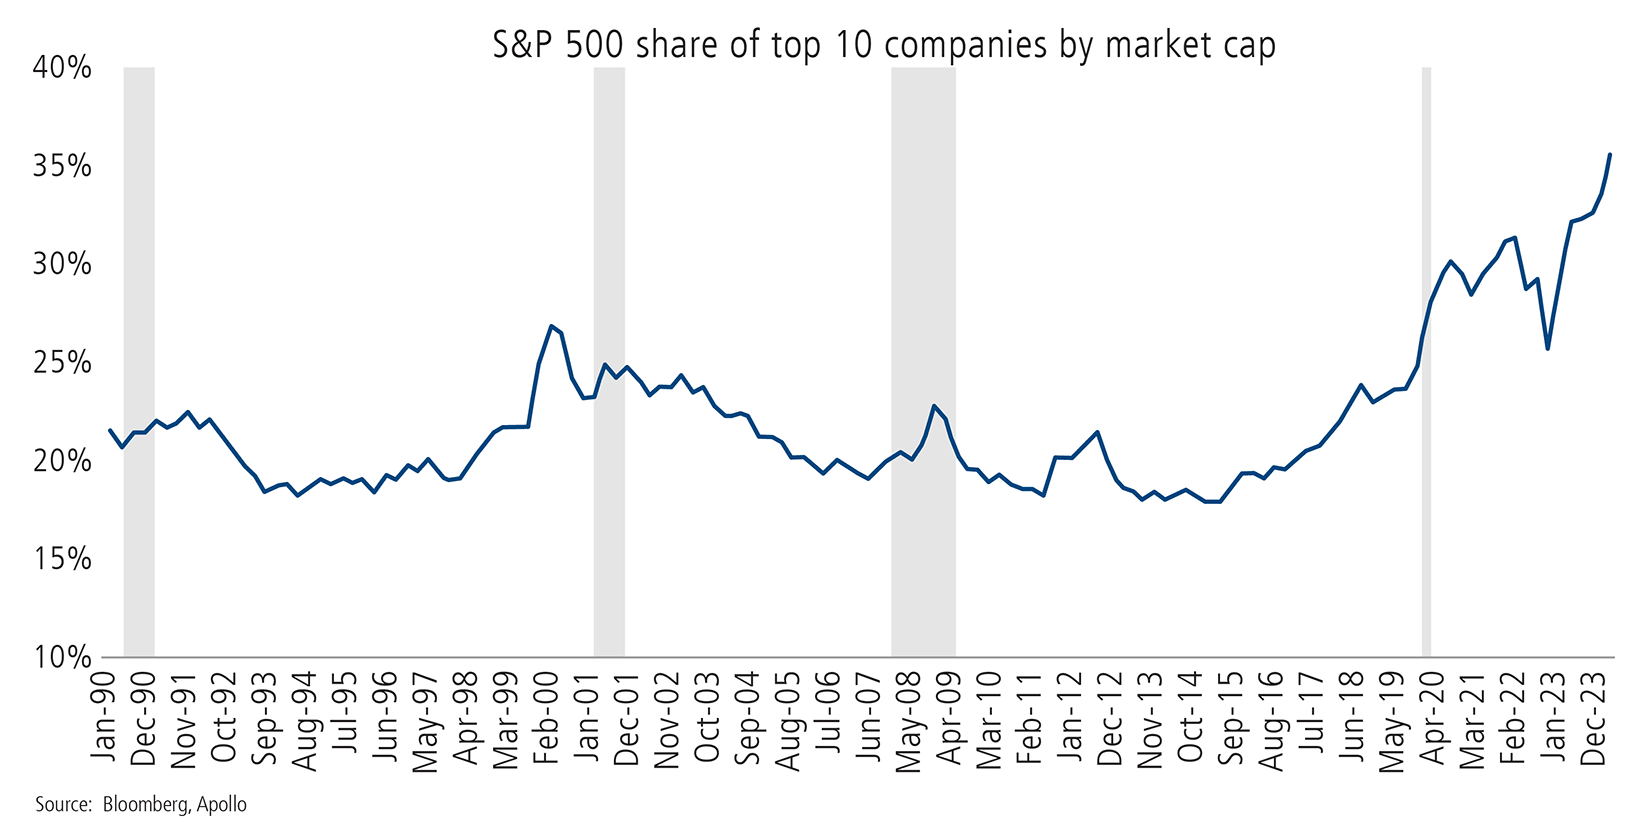
Earnings estimates for 2024 appeared optimistic at the beginning of this year and companies have largely delivered, with strong earnings momentum driving markets higher, led by the boom in artificial intelligence (AI). As of the publication of this article, NVIDIA is now the largest US company, passing Microsoft during the quarter. The AI surge has led NVIDIA to contribute over 1/3 of the nearly 15% year-to-date climb in the S&P 500, nearly as much as the entire index excluding the “Magnificent Seven.” NVIDIA is also the largest contributor to earnings growth and revenue growth in the Information Technology (IT) sector. If it were to be excluded from the IT sector, estimated earnings growth for Q2 would fall to 6.6% from 16.1%. The huge run up in NVIDIA and other large tech names has led to a significant concentration in the S&P 500 that we’ve noted previously (see below chart). This concentration supports the case for investors to seek diversification in areas like private alternatives.
The concentration in the S&P 500 is more and more extreme
Similarly on the US economic front, data releases continue to come in solidly, led by strong employment figures. The May jobs report showed that the economy added 272,000 jobs, well above economist expectations. The US unemployment rate has risen 0.6% from the lows, but we remain at historically low unemployment levels. It is difficult to believe that despite the rapid rate hike cycle from the Fed, the economy continues to power on and unemployment has only increased modestly. We remain optimistic on the US economic and earnings outlook and maintain a bias toward US equities.
What About the Election?
The US presidential election is sure to be a key event for markets later this year. We are keeping a close eye on polls and monitoring the impact of inflation and labor market data on President Biden’s reelection prospects.
The circumstances around this election are unique, in the fact that both candidates have been president previously. From an investment perspective, markets have fared well during both candidates’ terms in office, which should give investors some level of confidence.
From a policy standpoint, there are a few key differences in the candidates’ proposals. One potential divergence is former president Trump’s intent to increase tariffs on U.S. trading partners, particularly China. Taxes are another key issue with both candidates seeming to support at least a partial extension of the 2017 tax cuts, though they of course differ in how to pay for this.
As a reminder, if the Tax Cuts and Jobs Act expires after 2025 as scheduled, the top marginal tax rates would increase to 39.6% (from 37%) and the lifetime estate and gift tax exemption would be cut in half from the current $13.61 million per person today.
What to Expect in the Second Half
In our 2024 outlook, we outlined key risks to the market while maintaining a constructive view on risk assets. The three factors that we address in the above (Fed, Economic/Earnings strength and the election) will be important considerations throughout the remainder of the year. While we expect economic momentum to slow modestly, we continue to believe that it possible for the Fed to “get it right” and manage the transition to lower growth and slower inflation. We will write more about the election in the fall as it is still very early in the election cycle and polls continue to project a very close race.
1Factset
This material is distributed for informational purposes only. The information contained herein is based on internal research derived from various sources and does not purport to be statements of all material facts relating to the information mentioned, and while not guaranteed as to the accuracy or completeness, has been obtained from sources we believe to be reliable. Opinions, estimates, forecasts, and statements of financial market trends that are based on current market conditions constitute our judgment and are subject to change without notice. The views and strategies described may not be suitable for all investors. References to specific securities, asset classes and financial markets are for illustrative purposes only and are not intended to be, and should not be interpreted as, recommendations. The opinions and views of third parties do not represent the opinions or views of Calamos Wealth Management LLC. Opinions referenced are as of the date of publication and are subject to change due to changes in the market, economic conditions, or changes in the legal and/or regulatory environment and may not necessarily come to pass. This information is provided for informational purposes only and should not be considered tax, legal, or investment advice.
Past performance may not be indicative of future results. Different types of investments involve varying degrees of risk. Therefore, it should not be assumed that future performance of any specific investment or investment strategy (including the investments and/or investment strategies recommended and/or undertaken by Calamos Wealth Management, LLC [“Calamos”]), or any non-investment related services, will be profitable, equal any historical performance level(s), be suitable for your portfolio or individual situation, or prove successful. Calamos is neither a law firm, nor a certified public accounting firm, and no portion of its services should be construed as legal or accounting advice. Moreover, you should not assume that any discussion or information contained in this document serves as the receipt of, or as a substitute for, personalized investment advice from Calamos. Please remember that it remains your responsibility to advise Calamos, in writing, if there are any changes in your personal/financial situation or investment objectives for the purpose of reviewing/evaluating/revising our previous recommendations and/or services, or if you would like to impose, add, or to modify any reasonable restrictions to our investment advisory services. A copy of our current written disclosure Brochure discussing our advisory services and fees is available upon request or at wm.calamos.com. Diversification and asset allocation does not guarantee a profit or protect against a loss.
Historical performance results for investment indices, benchmarks, and/or categories have been provided for general informational/comparison purposes only, and generally do not reflect the deduction of transaction and/or custodial charges, the deduction of an investment management fee, nor the impact of taxes, the incurrence of which would have the effect of decreasing historical performance results. It should not be assumed that your account holdings correspond irectly to any comparative indices or categories. Please Also Note: (1) performance results do not reflect the impact of taxes; (2) comparative benchmarks/indices may be more or less volatile than your accounts; and, (3) a description of each comparative benchmark/index is available upon request.
S&P 500 Index is generally considered representative of the US stock market.
The S&P 500® Equal Weight Index (EWI) is the equal-weight version of the widely-used S&P 500. The index includes the same constituents as the capitalization weighted S&P 500, but each company in the S&P 500 EWI is allocated a fixed weight - or 0.2% of the index total at each quarterly rebalance.
The Nasdaq Composite Index is a market capitalization-weighted index of more than 2,500 stocks listed on the Nasdaq stock exchange. It is a broad index that is heavily weighted toward the important technology sector. The index is composed of both domestic and international companies.
The Russell 1000 Growth and Value US ESG Indexes are alternatively-weighted US equity indexes based on the Russell US Style Indexes. The indexes are designed to meet improved index level ESG profile, while maintaining similar risk/return characteristics to the underlying universe.
The Bloomberg US Agg Index is a broad-based flagship benchmark that measures the investment grade, US dollar-denominated, fixed-rate taxable bond market. The index includes Treasuries, government-related and corporate securities, MBS (agency fixed-rate pass-throughs), ABS and CMBS (agency and non-agency).
CWM 822358 0624