Investment Insights Home Page
Monthly Market Commentary - October 2023
November 7, 2023
October 2023 saw the S&P 500 fall for a third consecutive month, the longest slide since 2020. The US 10-year treasury yield briefly touched 5% mid-month before settling below that level for the last couple of weeks of October. Below we focus on three key themes that have influenced markets this month.
Key Date: November 1
As widely expected, the Fed held rates steady for the second consecutive meeting at the Oct. 31–Nov. 1 FOMC meeting. Core inflation crept up in September, and economic data continued to surprise to the upside. While data are expected to slow, the Fed appears to be retaining its tightening bias.
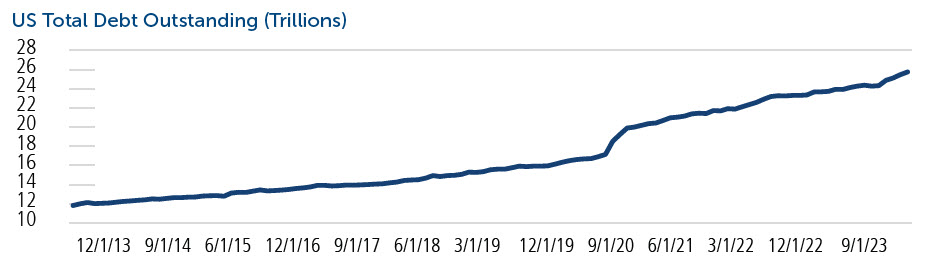
Though there was a Fed announcement on the same day, markets were just as focused on the US Treasury’s quarterly debt-issuance plan. The Treasury said it will sell $112 billion in longer-term securities at its quarterly refunding auctions next week, which was modestly below the $114 billion figure expected by major dealers. Bond yields have surged since the department’s last debt issuance plan in August. The lower-than-expected Treasury sale provided a bit of calm to bond markets in what has been a volatile few months. Still, the federal deficit has roughly doubled relative to a year ago, and we are watching supply-and-demand dynamics closely.
Blowout US Economic Growth
While many were skeptical of the 5-6% real-time gross domestic product (GDP) estimates (i.e., Atlanta Fed GDPNow), they turned out to be relatively accurate, with the US economy growing at a 4.9% annual rate in the third quarter, well above expectations and the fastest growth since 2021. This growth was driven heavily by a surge in personal spending, which jumped 4%, also the most since 2021. As we have noted in past commentaries, the continued resilience of the US consumer has been the enduring strength of the job market and continued strong wage growth.
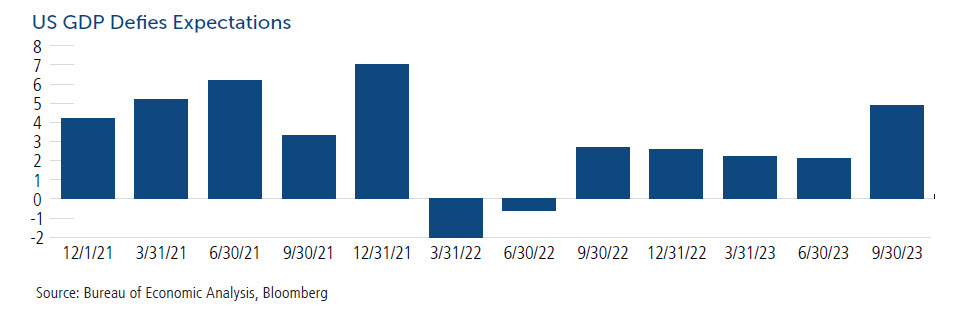
Forecasts for Q4 economic growth are significantly lower with an economist consensus of around 1%. If growth were to continue to surprise to the upside, it may warrant tighter monetary policy or, at the very least, would push out potential Fed rate cuts.
Big Tech Pauses but Still Driving Markets Higher
The “Magnificent 7” tech giants have garnered many of the headlines this year as they have propped up US equities. While the S&P 500 is up over 10% this year, without these seven large tech companies, the S&P 500 would be down for the year. During the month of October these large names saw a significant deviation in performance, with Tesla stock falling nearly 20%, whereas Amazon and Microsoft were up 4.7% and 7.1%, respectively.
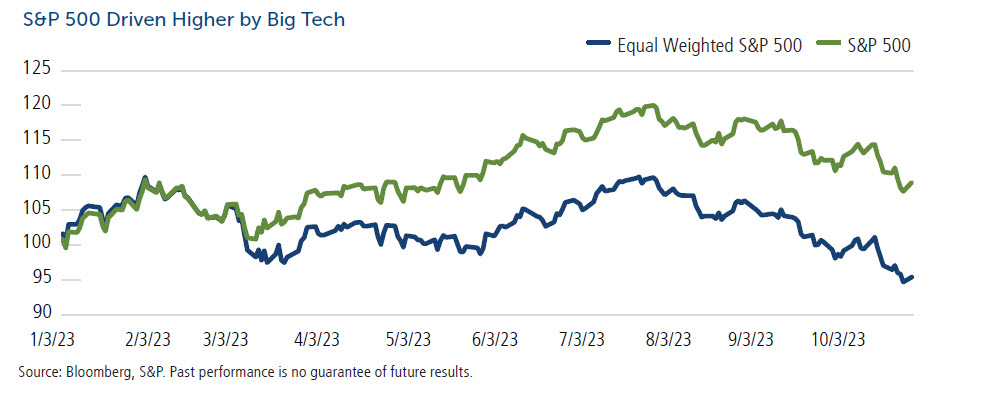
The artificial intelligence (AI) narrative will continue to be in focus for equity markets, and investors will concentrate intensively on earnings reports for these companies, looking to determine the appropriate amount of AI benefit to price into these stocks.
The S&P 500® is widely regarded as the best single gauge of large-cap US equities and serves as the foundation for a wide range of investment products. The index includes 500 leading companies and captures approximately 80% of available market capitalization.
Russell 2000 Index
The Russell 2000 Index comprises the smallest 2,000 companies in the Russell 3000 Index, representing approximately 8% of the Russell 3000 total market capitalization.
Bloomberg Barclays Aggregate Index
The Bloomberg US Aggregate Index is a broad-based flagship benchmark that measures the investment grade, US dollar-denominated, fixed-rate taxable bond market. The index includes Treasuries, government-related and corporate securities, MBS (agency fixed-rate pass-throughs), ABS, and CMBS (agency and non-agency).
Gross Domestic Product
The gross domestic product (GDP) measures the final market value of all goods and services produced within a country. It is the most frequently used indicator of economic activity.
VIX Index
The VIX Index is a financial benchmark designed to be an up-to-the-minute market estimate of the expected volatility of the S&P 500 Index.
This material is distributed for informational purposes only. The information contained herein is based on internal research derived from various sources and does not purport to be statements of all material facts relating to the information mentioned, and while not guaranteed as to the accuracy or completeness, it has been obtained from sources we believe to be reliable. Opinions, estimates, forecasts, and statements of financial market trends that are based on current market conditions constitute our judgment and are subject to change without notice. The views and strategies described may not be suitable for all investors. References to specific securities, asset classes, and financial markets are for illustrative purposes only and are not intended to be, and should not be interpreted as, recommendations. The opinions and views of third parties do not represent the opinions or views of Calamos Wealth Management LLC. Opinions referenced are as of the date of publication and are subject to change due to changes in the market, economic conditions, or legal and/or regulatory environment and may not necessarily come to pass. This information is provided for informational purposes only and should not be considered tax, legal, or investment advice.
Past performance may not be indicative of future results. Different types of investments involve varying degrees of risk. Therefore, it should not be assumed that future performance of any specific investment or investment strategy (including the investments and/or investment strategies recommended and/or undertaken by Calamos Wealth Management LLC [“Calamos”]), or any non-investment-related services, will be profitable, equal to any historical performance level(s), suitable for your portfolio or individual situation, or prove successful. Calamos is neither a law firm nor a certified public accounting firm, and no portion of its services should be construed as legal or accounting advice. Moreover, you should not assume any discussion or information contained in this document serves as the receipt of, or as a substitute for, personalized investment advice from Calamos. Please remember that it remains your responsibility to advise Calamos, in writing, if there are any changes in your personal/financial situation or investment objectives for the purpose of reviewing/evaluating/revising our previous recommendations and/or services or if you would like to impose, add, or to modify any reasonable restrictions to our investment advisory services. A copy of our current written disclosure Brochure discussing our advisory services and fees is available upon request or at wm.calamos.com.
Historical performance results for investment indices, benchmarks, and/or categories have been provided for general informational/comparison purposes only and generally do not reflect the deduction of transactional and/or custodial charges, the deduction of an investment management fee, nor the impact of taxes, the incurrence of which would have the effect of decreasing historical performance results. It should not be assumed that your account holdings correspond directly to any comparative indices or categories. Please also note (1) performance results do not reflect the impact of taxes, (2) comparative benchmarks/indices may be more or less volatile than your accounts, and (3) a description of each comparative benchmark/index is available upon request.