Investment Insights Home Page
Monthly Market Commentary - July 2023
August 1, 2023
July saw a continued run-up in equities on the back of reduced fears about inflation as well as better-than-expected economic data. For the month, the S&P 500 Index was up 2.9%, while US bonds (measured by Barclays Aggregate Bond Index) were very slightly negative at -0.1%. The US dollar sold off modestly versus a broad basket of currencies, driven by increased investor risk appetite. Notably, US Small Caps (measured by the Russell 2000) outperformed US Large Caps (S&P 500) for a second consecutive month, suggesting some signs of a broadening of equity performance.
Below, we focus on three key themes that have influenced markets this month.
End of the Hikes?
We may have made it to the top of the mountain with respect to interest rate hikes from the Federal Reserve (Fed). As widely expected, the Fed raised interest rates by a quarter percentage point, the 11th such increase since March 2022, and signaled that further tightening remained possible if warranted. Looking out at the rest of the year, markets imply about a 50% chance of one additional rate hike before year-end.
Fed Chair Jerome Powell wants to keep maximum flexibility around future interest rate changes and has made it very clear that the Fed is data-dependent. As Powell stated in his press conference following the July meeting, “We’ve come a long way” and “We can afford to be a little patient.”
The big question for investors is when we will start the descent down the mountain. Messaging out of the Fed continues to follow the script of keeping rates on hold for at least a year before considering rate cuts. However, the markets remain unconvinced, with cuts priced in beginning next spring.
Soft Landing More Likely
Who would have predicted that despite the rapid pace of interest rate hikes over the past year and a half, unemployment would be at exactly the same low level (3.6%) as when the Fed started raising rates? That is exactly the situation we find ourselves in, with economists and the Fed alike surprised by the resilience of economic growth. This scenario has seemed like much more of a “best case” long shot coming into the year. US Gross Domestic Product growth surprised to the upside in the second quarter, rising 2.4% with stronger consumer spending than expected.
Economic Surprise Index
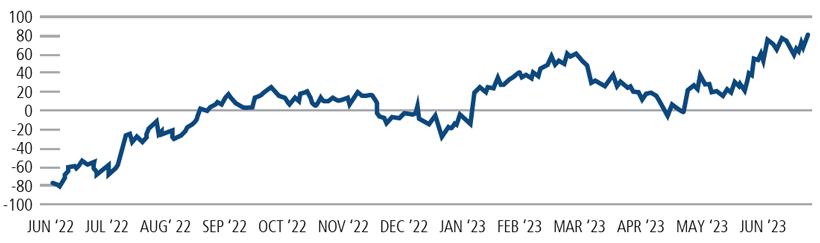
Source: Citi, Bloomberg as of 7/27/23. The Citi Economic Surprise Indices measure data surprises relative to market expectations. A positive reading means that data releases have been stronger than expected, and a negative reading means that data releases have been worse than expected.
This has all led to the Fed staff no longer forecasting a recession, as Powell highlighted in his post-meeting press conference. Some risk factors remain, particularly the potential for renewed challenges in the banking sector as well as the risk that inflation picks back up. The significant increase in oil prices this month has fueled some of these concerns.
We continue to expect a soft landing, with recent economic and inflation data providing more support for this view.
Another Negative Quarter for Corporate Earnings
The S&P 500 will likely report a decline in earnings for a third consecutive quarter in Q2. Despite this earnings recession, stocks have continued to climb, making valuations look slightly stretched by some measures like forward P/E ratio. Can this dynamic continue, or will earnings growth need to turn sharply positive to support further gains? Our bias is toward the latter, particularly given the increasing attractiveness of high-qualifying fixed income.
With respect to the current earnings season, the financial sectors have been a main focus for analysts and investors. Earnings reports from the big banks were generally better than expected; however, banks sharply increased the money set aside for potential loan losses, reflecting slowing economic growth.
Seven of the 11 sectors are expected to report year-over-year earnings growth (led by Consumer Discretionary and Communication Services), while four sectors are expected to report a year-over-year earnings decline (led by Energy and Materials). Looking further out, analysts are projecting roughly flat earnings growth in Q3, followed by a sharp increase in earnings growth in Q4 of nearly 8%. We will be monitoring these earnings releases closely to determine if they support continued gains in equities.
Conclusion
The aggressive hiking campaign by the Fed has yet to derail the US economy. We remain relatively optimistic about the economic backdrop as the employment market and consumer spending remain robust. Corporate earnings growth will need to improve in the second half of the year to support further equity gains.
The S&P 500® is widely regarded as the best single gauge of large-cap U.S. equities and serves as the foundation for a wide range of investment products. The index includes 500 leading companies and captures approximately 80% coverage of available market capitalization.
The Russell 2000 Index is comprised of the smallest 2000 companies in the Russell 3000 Index, representing approximately 8% of the Russell 3000 total market capitalization.
The Bloomberg US Agg Index is a broad-based flagship benchmark that measures the investment grade, US dollar-denominated, fixed-rate taxable bond market. The index includes Treasuries, government-related and corporate securities, MBS (agency fixed-rate pass-throughs), ABS and CMBS (agency and non-agency).
Gross domestic product (GDP) measures the final market value of all goods and services produced within a country. It is the most frequently used indicator of economic activity.
This material is distributed for informational purposes only. The information contained herein is based on internal research derived from various sources and does not purport to be statements of all material facts relating to the information mentioned, and while not guaranteed as to the accuracy or completeness, has been obtained from sources we believe to be reliable. Opinions, estimates, forecasts, and statements of financial market trends that are based on current market conditions constitute our judgment and are subject to change without notice. The views and strategies described may not be suitable for all investors. References to specific securities, asset classes and financial markets are for illustrative purposes only and are not intended to be, and should not be interpreted as, recommendations. The opinions and views of third parties do not represent the opinions or views of Calamos Wealth Management LLC. Opinions referenced are as of the date of publication and are subject to change due to changes in the market, economic conditions, or changes in the legal and/or regulatory environment and may not necessarily come to pass. This information is provided for informational purposes only and should not be considered tax, legal, or investment advice.
Past performance may not be indicative of future results. Different types of investments involve varying degrees of risk. Therefore, it should not be assumed that future performance of any specific investment or investment strategy (including the investments and/or investment strategies recommended and/or undertaken by Calamos Wealth Management, LLC [“Calamos”]), or any non-investment related services, will be profitable, equal any historical performance level(s), be suitable for your portfolio or individual situation, or prove successful. Calamos is neither a law firm, nor a certified public accounting firm, and no portion of its services should be construed as legal or accounting advice. Moreover, you should not assume that any discussion or information contained in this document serves as the receipt of, or as a substitute for, personalized investment advice from Calamos. Please remember that it remains your responsibility to advise Calamos, in writing, if there are any changes in your personal/financial situation or investment objectives for the purpose of reviewing/evaluating/revising our previous recommendations and/or services, or if you would like to impose, add, or to modify any reasonable restrictions to our investment advisory services. A copy of our current written disclosure Brochure discussing our advisory services and fees is available upon request or at wm.calamos.com.
Historical performance results for investment indices, benchmarks, and/or categories have been provided for general informational/comparison purposes only, and generally do not reflect the deduction of transaction and/or custodial charges, the deduction of an investment management fee, nor the impact of taxes, the incurrence of which would have the effect of decreasing historical performance results. It should not be assumed that your account holdings correspond directly to any comparative indices or categories. Please Also Note: (1) performance results do not reflect the impact of taxes; (2) comparative benchmarks/indices may be more or less volatile than your accounts; and, (3) a description of each comparative benchmark/index is available upon request.