Investment Insights Home Page
Monthly Market Commentary - August 2023
September 7, 2023
Volatility made a brief return to financial markets during August, with both equities and bonds selling off. For the month, the S&P 500 Index was down -1.6%, while US bonds (measured by Bloomberg US Aggregate Bond Index) returned -0.6%. The US dollar rallied, driven by stronger economic data. US Small Caps (measured by the Russell 2000) underperformed US Large Caps (S&P 500), giving back the relative gains of the past two months.
Below, we focus on three key themes that have influenced markets this month.
Jackson Hole—Main Event or Nonevent?
Heading into the Fed’s annual economic policy conference at Jackson Hole, there was much speculation about Chair Jerome Powell’s speech. Would he use it as an opportunity to signal that the hiking cycle was finished? That more hikes were on the way? Or maybe that the Fed was considering raising its inflation target? In the end, Powell’s speech (and the resultant market reaction) was fairly uneventful because he stuck to his previous themes for the most part, with little information that could be considered “new.”
Perhaps most important, Powell preserved the Fed’s optionality going forward. Although “higher for longer” is a message that the Fed would like to impart on investors, this is a Fed that is clearly “data dependent” and wishes to retain maximum flexibility on potential rate moves. We continue to believe that market expectations for rate cuts may need to be pushed further out.
Economic Strength Continues
Last month, we highlighted the strength of US economic surprises. Although this momentum has slowed in the past couple of weeks, this does not appear to be an economy close to recession. Retail sales came in stronger than expected during the month, as did the ever-important payrolls report for August. Notably, the unemployment rate ticked up to 3.8% (from 3.5%), leading to speculation that the Fed will refrain from additional rate hikes, at least in the very short term. Another positive factor was an increase in the labor force participation rate, watched closely by the Fed.
Volatility Returns, But Only Briefly
One notable feature of the summer months has been the low level of volatility, particularly in equity markets. We feel this has been mainly due to the stronger-than-expected economic data that we have previously referenced. The VIX has remained in a narrow range between 13– and 15 for much of the summer.
Exhibit 1: Low Volatility Environment Returns After Brief Increase
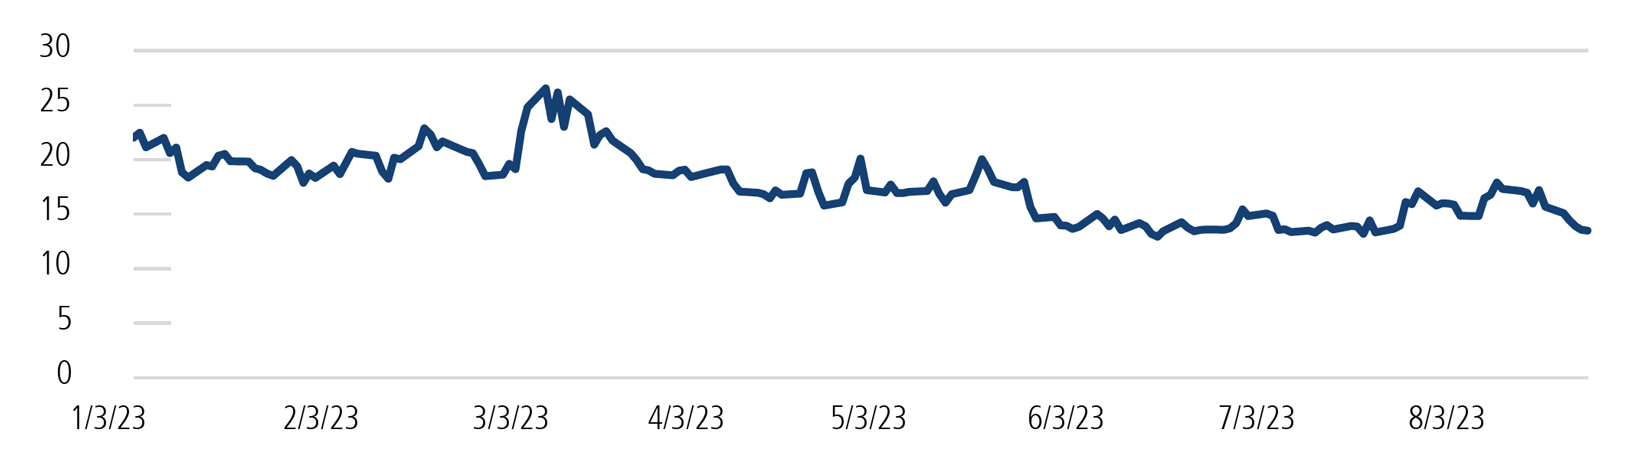
Source: Chicago Board Options Exchange. Past performance is no guarantee of future results.
This changed in mid-August as the VIX climbed to 18, before falling back below 14 at month-end. The brief spike enabled us to increase our activity in our options program and take advantage of the change in pricing.
Although a soft landing remains our base case, we stand ready to adjust positioning if expectations around the Fed, economic data, and volatility change.
The S&P 500 is widely regarded as the best single gauge of large-cap US equities and serves as the foundation for a wide range of investment products. The index includes 500 leading companies and captures approximately 80% coverage of available market capitalization.
The Russell 2000 Index is composed of the smallest 2000 companies in the Russell 3000 Index, representing approximately 8% of the Russell 3000 total market capitalization.
The Bloomberg US Aggregate Index is a broad-based flagship benchmark that measures the investment grade, US dollar-denominated, fixed-rate taxable bond market. The index includes Treasuries, government-related and corporate securities, MBS (agency fixed-rate pass-throughs), ABS, and CMBS (agency and non-agency).
Gross domestic product (GDP) measures the final market value of all goods and services produced within a country. It is the most frequently used indicator of economic activity.
The VIX Index is a financial benchmark designed to be an up-to-the-minute market estimate of the expected volatility of the S&P 500 Index.
This material is distributed for informational purposes only. The information contained herein is based on internal research derived from various sources and does not purport to be statements of all material facts relating to the information mentioned, and while not guaranteed as to the accuracy or completeness, it has been obtained from sources we believe to be reliable. Opinions, estimates, forecasts, and statements of financial market trends that are based on current market conditions constitute our judgment and are subject to change without notice. The views and strategies described may not be suitable for all investors. References to specific securities, asset classes, and financial markets are for illustrative purposes only and are not intended to be, and should not be interpreted as, recommendations. The opinions and views of third parties do not represent the opinions or views of Calamos Wealth Management LLC. Opinions referenced are as of the date of publication and are subject to change due to changes in the market, economic conditions, or changes in the legal and/or regulatory environment and may not necessarily come to pass. This information is provided for informational purposes only and should not be considered tax, legal, or investment advice.
Past performance may not be indicative of future results. Different types of investments involve varying degrees of risk. Therefore, it should not be assumed that future performance of any specific investment or investment strategy (including the investments and/or investment strategies recommended and/or undertaken by Calamos Wealth Management, LLC [“Calamos”]), or any non-investment related services, will be profitable, equal any historical performance level(s), be suitable for your portfolio or individual situation, or prove successful. Calamos is neither a law firm, nor a certified public accounting firm, and no portion of its services should be construed as legal or accounting advice. Moreover, you should not assume that any discussion or information contained in this document serves as the receipt of, or as a substitute for, personalized investment advice from Calamos. Please remember that it remains your responsibility to advise Calamos, in writing, if there are any changes in your personal/financial situation or investment objectives for the purpose of reviewing/evaluating/revising our previous recommendations and/or services, or if you would like to impose, add, or to modify any reasonable restrictions to our investment advisory services. A copy of our current written disclosure Brochure discussing our advisory services and fees is available upon request or at wm.calamos.com.
Historical performance results for investment indices, benchmarks, and/or categories have been provided for general informational/comparison purposes only and generally do not reflect the deduction of transaction and/or custodial charges; the deduction of an investment management fee; or the impact of taxes, the incurrence of which would have the effect of decreasing historical performance results. It should not be assumed that your account holdings correspond directly to any comparative indices or categories. Please also note (1) performance results do not reflect the impact of taxes, (2) comparative benchmarks/indices may be more or less volatile than your accounts, and (3) a description of each comparative benchmark/index is available upon request.