Investment Insights Home Page
Global Infrastructure Investments
December 13, 2019
By: J. Reed Murphy, CIO
Contributions by: Rob Young, CFA
As an asset class, global infrastructure can be a compelling investment. This paper will answer three important questions as a primer to build the case for their inclusion in an allocation strategy:
> What is infrastructure?
> Does it provide a unique investment opportunity?
> What is the future outlook?
What is Infrastructure?
Many investors think that investing in global infrastructure involves timing investments in companies that provide basic materials (e.g., concrete or asphalt) to infrastructure projects. That is a cyclical and volatile investment proposition. We believe that strategic investing in global infrastructure should ideally be more broadly represented through essential services with underlying companies that offer the following:
- Access to long-term assets – Investments are generally in business that are not easily replicated or diminished and with long-life assets, providing long-term sources of income and growth opportunities
- High barriers to entry – Companies that are highly regulated, involve significant capital outlays to provide the services, and are generally immune from competitive products or services.
- Inelasticity – Businesses that tend to not be highly correlated with economic activity, particularly booms or busts.
- Steady cash flows – Businesses that possess monopolistic or oligopolistic characteristics. The natural result of the aforementioned fundamentals is that these businesses are generally supported by long-term contracts with inflation escalators (supported by government regulations).
- Lower Risk of Capital Loss – Due to their business models, companies tend to show lower likelihoods of capital loss within their businesses and lower levels of downside loss through their stock performance.
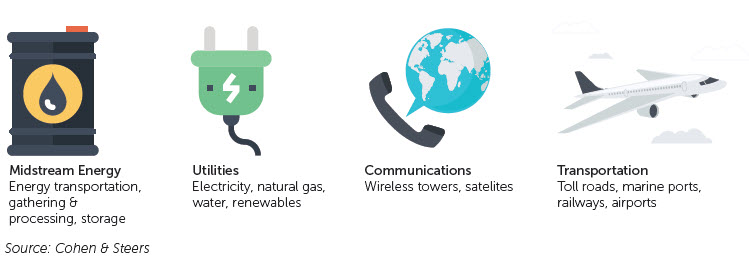
Global Infrastructure covers a vast and broadly idiosyncratic group of markets that range from toll roads, electricity, railroads, telecommunications, water utilities, airports, and ports. The common denominator is that they play a critical role in socio-economic development and quality of life. The nearly $2 trillion global listed infrastructure universe (as of June 2018) consists primary of companies that own and operate assets, grouped into four main categories
Exhibit 1: What Is Infrastructure?
Infrastructure investments can help drive economic growth by boosting activity and enhancing productivity, but capital raising can be elusive due to large upfront capital requirements and a long-tailed return profile. As a result, the spread between the current infrastructure spending growth trajectory and the investment need has continued to widen.
Does Infrastructure Provide a Unique Investment Opportunity?
As highlighted, essential service infrastructure has its own distinct set of business models. This has created a unique performance behavior. Since 2001, publicly traded infrastructure companies have provided market-like or higher returns than global equities (MSCI AWC Index) with less overall volatility better downside risk, and higher yields.
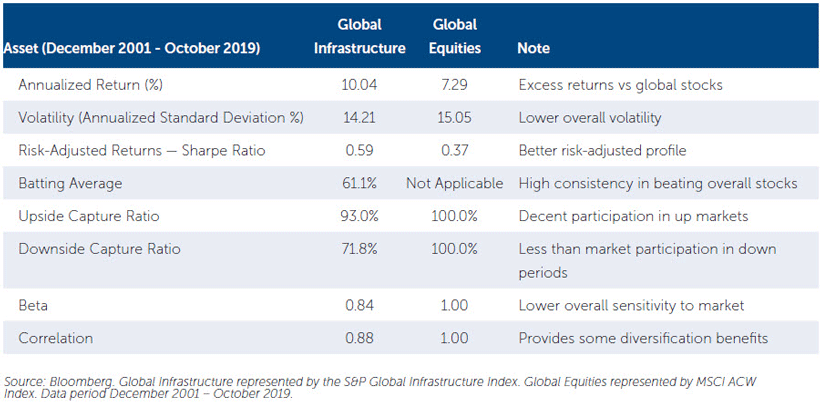
Exhibit 2 shows data from the S&P Global Infrastructure Index For the since inception time period, global infrastructure provided better than market returns, a strong consistency of beating broad global equity benchmarks (i.e., batting average of annual returns), with slightly lower volatility (i.e., standard deviation), and lower overall market sensitivity (i.e., lower beta). Other indices show market-like returns with significantly less overall volatility. Either way, the historical behavior of infrastructure has been slightly less than market returns during up markets (i.e., upside capture ratio) with much better returns during down markets (i.e., downside capture ratio).
Exhibit 2: Global Infrastructure Performance Behavior
Global Infrastructure also has an attractive yield component. Exhibit 4 shows the dividend yield of both the global infrastructure and global equity benchmarks. Based on their strong and steady cash flow levels and growth, infrastructure consistently provides better overall yields than the overall market. As of October 2019, the yield on global infrastructure was 4.1% vs. 2.5% for global equity.
What is the future outlook?
According to Oxford Economics, global infrastructure spending has gradually increased from $1.8 trillion annually in 2007 to $2.3 trillion in 2015, representing a 2.9% compounded average growth rate (CAGR). As a proportion of global GDP, infrastructure spending has remained broadly consistent over the last decade at approximately three percent. Regionally, the proportion of global infrastructure spending has skewed to Asia, which accounted for 59% in 2015 versus 49% in 2007 with the remainder stemming primarily from Europe and the Americas.
Exhibit 3: Global Infrastructure Returns Greater than Global Equities
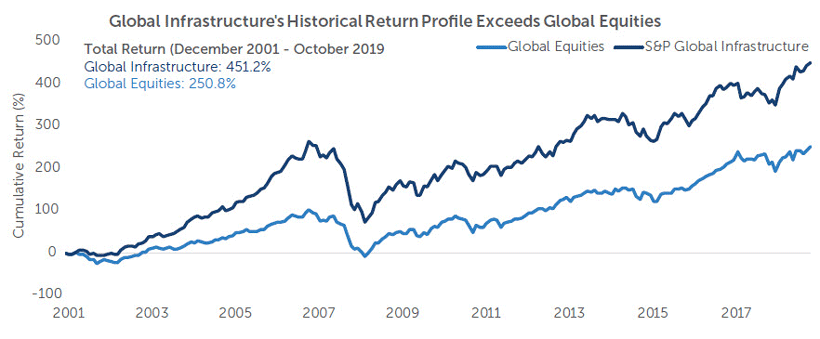
Source: Bloomberg. Global Infrastructure represented by the S&P Global Infrastructure Index. Global Equities represented by MSCI ACW Index. Data period December 2001 – October 2019.
Future infrastructure investment is linked to overall economic growth – as economies and income increase, the needs for essential services such as power, water, and transportation grows. Urbanization is another contributing component to future infrastructure needs as residents migrate to urban centers and take advantage of economic and social opportunities afforded them with increasing wealth.
While estimates for future global infrastructure needs vary based on the source, the overwhelming consensus is that current spending is at a significant shortfall relative to expected needs. Oxford Economics believes $3.7 trillion per year is needed from 2016 to 2040 with road and electricity markets capturing approximately 67% of this need, followed by investments in rail, telecommunications, and water. While risks to any investment exist, the significant capital shortfall provides a compelling case for infrastructure on a global scale (Exhibit 4).
Exhibit 4: Global Infrastructure Investment Spending Is Set to Increase
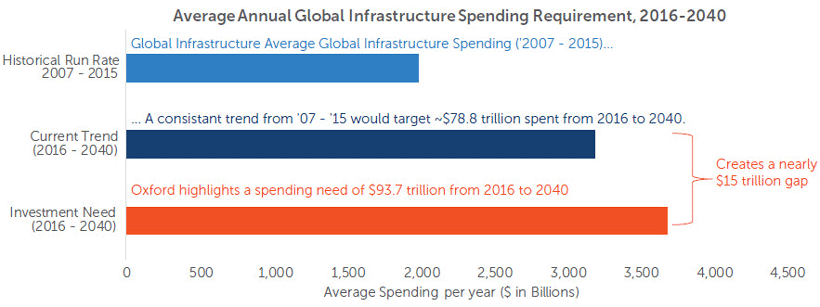
Source: Oxford Economics
Conclusion
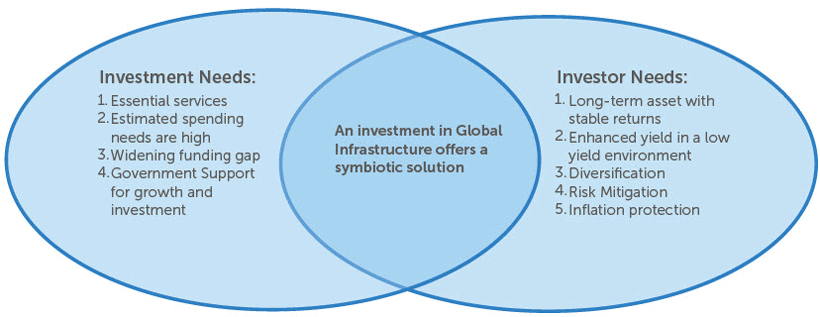
Global infrastructure is a growing market with attractive guard rails that may help limit asset class volatility. Underlying businesses often possess predictable and stable cash flows that are supported by long-term contracts, attractive regulatory backdrops, high entry barriers, and little threat from substitutes (Exhibit 5). Given the unique characteristics of the asset class, and the myriad of companies included in it, taking an active management approach may offer the best approach to benefiting from this exposure.
Exhibit 5: Highlighting the Symbiotic Relationship Between Investment and Investor Needs
Source: Oxford Economics, CWM Research
Definitions:
Batting Average: An investment manager’s “batting average” is a statistical technique used to measure a manager’s ability to meet or beat an index. A batting average is calculated by dividing the number of days (or months, quarters, etc.) in which the manager beats or matches the index by the total number of days (or months, quarters, etc.) in the period of question and multiplying that factor by 100.
Standard Deviation: is a statistic that measures the dispersion of a dataset relative to its mean and its calculated as the square root of the variance.
Sharpe Ratio: the ratio is the average return earned in excess of the risk-free rate per unit of volatility or total risk.
Down-Market Capture Ratio: The down-market capture ratio is a statistical measure of an investment manager’s overall performance in down-markets.
Beta: a beta coefficient is a measure of the volatility, or systematic risk, of an individual stock in comparison to the unsystematic risk of the entire market.
Correlation: in the finance and investment industries, is a statistic that measures the degree to which two securities move in relation to each other.
MSCI ACW Index: MSCI ACWI is a market capitalization weighted index designed to provide a broad measure of equity-market performance throughout the world.
S&P Global Infrastructure Index: is designed to track 75 companies from around the world chosen to represent the listed infrastructure industry while maintaining liquidity and tradability.
Opinions, estimates, forecasts, and statements of financial market trends that are based on current market conditions constitute our judgment and are subject to change without notice. The views and strategies described may not be suitable for all investors. References to specific securities, asset classes and financial markets are for illustrative purposes only and are not intended to be, and should not be interpreted as, recommendations.
Please remember that past performance may not be indicative of future results. Different types of investments involve varying degrees of risk, and there can be no assurance that the future performance of any specific investment, investment strategy, or product (including the investments and/or investment strategies recommended or undertaken by Calamos Wealth Management LLC), or any non-investment related content, made reference to directly or indirectly in this newsletter will be profitable, equal any corresponding indicated historical performance level(s), be suitable for your portfolio or individual situation, or prove successful. Due to various factors, including changing market conditions and/or applicable laws, the content may no longer be reflective of current opinions or positions.
Moreover, you should not assume that any discussion or information contained in this newsletter serves as the receipt of, or as a substitute for, personalized investment advice from Calamos Wealth Management LLC. To the extent that a reader has any questions regarding the applicability of any specific issue discussed above to his/her individual situation, he/she is encouraged to consult with the professional advisor of his/her choosing. Calamos Wealth Management LLC is neither a law firm nor a certified public accounting firm and no portion of the newsletter content should be construed as legal or accounting advice. If you are a Calamos Wealth Management LLC client, please remember to contact Calamos Wealth Management LLC, in writing, if there are any changes in your personal/financial situation or investment objectives for the purpose of reviewing/evaluating/revising our previous recommendations and/or services. A copy of the Calamos Wealth Management LLC’s current written disclosure statement discussing our advisory services and fees is available upon request.