Investment Insights Home Page
ESG – A Clean Energy Perspective
March 18, 2021
While ESG (Environmental, Social, Governance) investing provide investors a broad spectrum of altruistic causes, the primary purpose of this paper is to explore one of the more popular and thematically specific investment options – Clean Energy. Clean energy encompasses greener (i.e., lower carbon) and sustainable (i.e., renewables) initiatives. We provide an overview of the energy landscape and a thesis for how the clean energy revolution started, where it’s headed and what it may mean for investors.
Addressing the Problem
Climate change is a growing risk and an economic reality. While skeptics have made the topic controversial, the investment thesis is unequivocal. Consumers not only want to invest in broader ESG initiatives, but studies show they are willing to pay more for goods and services to do so. In addition, governments across the globe are moving forcefully with regulations, subsidies, sanctions and incentives resulting in corporate reallocation of capital resources. Innovation in response to a changing climate and alternative energy is also delivering productivity and profitability gains and, consequently, new investment opportunities.
Support is gaining momentum coming out of the global pandemic-induced recession with Asia, China, United States and Europe all pinning fiscal stimulus to clean energy initiatives. European countries are a case study for all other nations. The European Green Deal has transformed from a long-dated climate plan to a current economic stimulus plan in Europe not seen since the Marshall Plan in the late 1940s to rebuild Europe after World War II. This should boost short-term wealth (GDP and employment) as well as protect long-term wealth by fighting climate change.
The Power of Electricity
Electricity is what powers our planet; our energy grid, homes, workplaces, and our economies. And, the electrification of nearly everything (e.g., automobiles) is driving a growing demand for energy. The traditional methods for creating electricity have historically come primarily from coal and other petro-chemicals, such as oil and gas. Electrical utility companies convert these commodities into electricity that powers our energy grids. However, the carbon emissions are argued to provide a negative impact on our environment, including but not limited to pollution and contributing to global warming.
As Exhibit 1 shows, electricity is growing rapidly as a percentage of total energy consumption. In 2015 electricity represented just 19% of total energy consumption. It is estimated to be 29% and 49% of total global energy consumption by the years 2030 and 2050, respectively.
Exhibit 1: Electricity Demand is Growing Creating More Demand for Energy Consumption
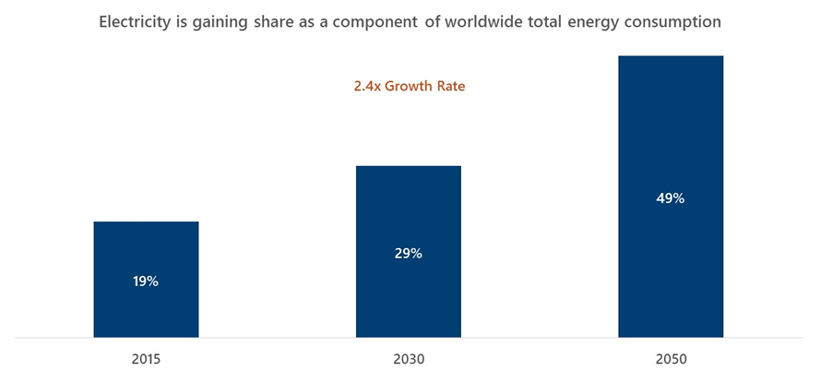
Source: McKinsey; Irena, June 2020, Tortoise Ecofin
New Sources of Energy
Newer sources of energy include nuclear, hydro, solar, wind and geothermal. As Exhibit 2 shows, the share of global energy is under a massive transition away from traditional energy sources, such as coal, to greener and renewable sources of energy.
Many analysts expect renewables and natural gas to account for 85% of energy supply growth from 2019 to 2040. And, 70% of investments in the electricity sector from 2020 to 2030 are expected to come from renewables with the largest market share gain coming from wind and solar. Natural gas, hydro, geothermal, biomass and nuclear are all expected to grow, while others -- particularly, coal -- are expected to contract. In fact, in the U.S. alone, renewables have already overtaken coal as a source of electricity production.
Exhibit 2: Greener & Renewable Sources of Energy Poised for Growth
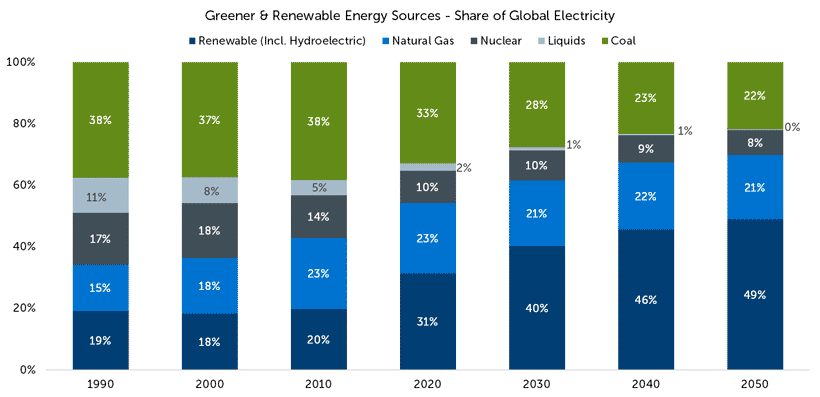
Source: Statista 2021, Global Energy Yearbook 2020
Innovation Begets Profitability
In their early stages of development, disruptive technologies often create or utilize underlying innovation and alternatives that are prohibitively expensive. As the innovation evolves, the cost structure declines making it more affordable. As costs decline below alternatives, the new technology displaces the old and drives down costs (and inflation) more broadly.
This type of transformation can be witnessed in the solar energy market. In its early days, costs were expensive, particularly more expensive than coal, for example. Without government subsidies and corporations investing in transformative technology, solar was not initially competitive. For example, the 2010 solar photovoltaic cost was 0.38 U.S. dollars per kilo-watt hour (kwh). However, by 2019 that cost had reduced to 0.05 USD/kwh – an 83% decline. As Exhibit 3 shows, solar and other green or renewable sources of energy are now cheaper than traditional methods.
Exhibit 3: Renewable Energy Costs are Often Below Traditional Sources
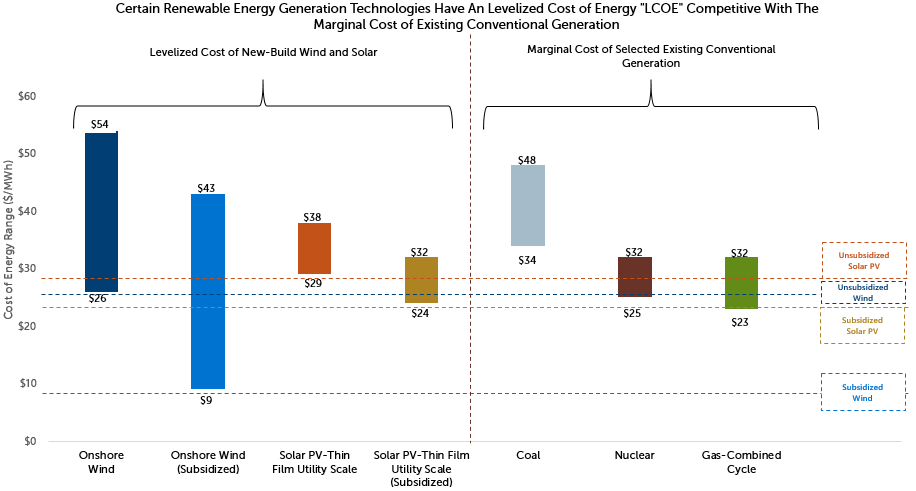
Source: Lazard
Note: Right side: Represents the marginal cost (the cost added by producing one additional unit of product or service) of operating fully depreciated gas combined cycle, coal and nuclear facilities, inclusive of decommissioning costs for nuclear facilities. Analysis assumes that the salvage value for a decommissioned gas combined cycle or coal asset is equivalent to its decommissioning and site restoration cost. Inputs are derived from a benchmark of operating gas combined cycle, coal and nuclear assets across the U.S. Capacity factors, fuel, variable and fixed operating expenses are based on upper and lower quartile estimates derived from Lazard research.
The subsidized analysis includes sensitivities related to the Tax Cuts and Jobs Act and U.S. Federal tax subsidies.
Left Side: Levelized Cost of Energy (LCOE): is a measure of the average net present cost of electricity generation for a generating plant over its lifetime. The LCOE is calculated as the ratio between all the discounted costs over the lifetime of an electricity generating plant divided by a discounted sum of the actual energy amounts delivered. The LCOE is used to compare different methods of electricity generation on a consistent basis. The LCOE "represents the average revenue per unit of electricity generated that would be required to recover the costs of building and operating a generating plant during an assumed financial life and duty cycle." Inputs to LCOE are chosen by the estimator. They can include cost of capital, decommissioning, "fuel costs, fixed and variable operations and maintenance costs, financing costs, and an assumed utilization rate.
Power Generation is a Key Investment Opportunity
With the strong tailwinds of growing populations and the electrification of many things, energy growth is expected to be strong. One of the best ways to invest in these trends is through power generation (i.e., utility companies). Utility companies are the biggest contributors to CO2 emissions and could be big beneficiaries in transitioning to clean energy. Many utility companies exhibit high barriers to entry, steady cash flows, attractive dividend yields and inflationary protection. Many are also in the process of transitioning their sources of energy from coal to natural gas (i.e., green) and renewables. In fact, estimates are that there has not been a new coal powered utility plant built in the United States in over a decade. As these companies make the transition, their profit margins expand. And, governments and companies are channeling resources toward the global infrastructure buildout, presenting another wind in their sails.
In Closing
Clean energy either through greener or renewable sources is here to stay. The investment case is significant. Estimates are that global infrastructure investments in clean technology and energy production more broadly could provide $1- to $2 trillion in investments per year just in the United States for years to come (separate from current government fiscal infrastructure programs being discussed). This could translate to 15 to 20 million new jobs worldwide. Investing in clean energy initiatives is an impactful way to be not only ESG conscious but could benefit from major trends of support going forward. Please contact your CWM wealth advisory professional if you have questions.
This material is distributed for informational purposes only. The information contained herein is based on internal research derived from various sources and does not purport to be statements of all material facts relating to the information mentioned, and while not guaranteed as to the accuracy or completeness, has been obtained from sources we believe to be reliable.
Opinions, estimates, forecasts, and statements of financial market trends that are based on current market conditions constitute our judgment and are subject to change without notice. The views and strategies described may not be suitable for all investors. References to specific securities, asset classes and financial markets are for illustrative purposes only and are not intended to be, and should not be interpreted as, recommendations.
Past performance may not be indicative of future results. Different types of investments involve varying degrees of risk. Therefore, it should not be assumed that future performance of any specific investment or investment strategy (including the investments and/or investment strategies recommended and/or undertaken by Calamos Wealth Management, LLC (“Calamos”), or any non-investment related content, will be profitable, equal any corresponding indicated historical performance level(s), be suitable for your portfolio or individual situation, or prove successful. Calamos is neither a law firm, nor a certified public accounting firm, and no portion of its services should be construed as legal or accounting advice. Moreover, you should not assume that any discussion or information contained in this presentation serves as the receipt of, or as a substitute for, personalized investment advice from Calamos.
Please remember that it remains your responsibility to advise Calamos, in writing, if there are any changes in your personal/financial situation or investment objectives for the purpose of reviewing/evaluating/revising our previous recommendations and/or services, or if you would like to impose, add, or to modify any reasonable restrictions to our investment advisory services. A copy of our current written disclosure Brochure discussing our advisory services and fees is available upon request or at www.calamos.com.
© 2021 Calamos Wealth Management. All Rights Reserved. Calamos® and Calamos Investments® are registered trademarks of Calamos Investments LLC.
6341_0321_CWM