Investment Insights Home Page
Asset Allocation in Goals Based World
November 20, 2019
The investment world is littered with too much information and it often lacks context. How does one sort through the reams of information to:
- Figure out what is legitimate and not legitimate,
- What is most relevant for their individual circumstance?
- How to act on information presented. And,
- How to manage going forward with the highest probability of success.
There are many issues to consider when evaluating each of these elements. However, two of the most important decisions are to determine your investment goals and get the optimal asset allocation structure in place to best help you achieve them.
Historical Context
The basic premise of asset allocation is that different asset classes offer different levels of risk and return opportunities, and are not perfectly correlated. By combining different asset classes, one can smooth out the ride and potentially increase returns and/or reduce risk. However, the structure behind this concept deserves a closer look.
Asset Allocation – An Academic Evolution
In 1986, a groundbreaking study by Gary Brinson, Randolph Hood, and Gilbert Beebower (”the BHB study”), established a framework for the investment community by, showing that the number one determinant of a portfolio’s return variability is asset allocation. Their study of large U.S. pension funds found that asset allocation accounted for 93.6% of the variation in investment performance with the remainder coming from investment vehicle selection, market timing, and other factors. Here is where a critical evaluation of the study is important, because it focused on the variation in return, not in the level of returns. This may sound like a small nuance, but it is not.
It seems the vast majority of financial advisors misinterpret the BHB study, or a follow-up study by Brinson, Beebower, and Singer in 1991, without understanding the context. Few may be aware that there have been a large number of additional studies that critique the original BHB study. One such study was conducted by William Jahnke in 1997. Jahnke argued “investors should be more concerned with the range of likely outcomes over their investment planning horizon than the volatility of returns.” Jahnke went on to state, “Fixed asset allocation solutions are inferior to analytically linking forward-looking strategic asset allocation solutions with financial planning. As the investor’s circumstances or market opportunities change, so also should the investor’s asset allocation.”
While this sounds like heady material, it really isn’t. Here’s what Jahnke was alluding to:
- First, asset allocation shouldn’t be a set-it-and-forget-it proposition.
- Second, the assumptions for specific market returns (e.g., domestic equities, fixed income) should be forward-looking, not based on a rear-view mirror of market returns.
- Third, successful investing should take into account a client’s financial situation.
- Fourth, return assumptions on markets should be revisited as circumstances change. A sound financial or investment planning strategy should be revisited as investor’s circumstances change in addition to market change.
Why Consider Forward-Looking Market Assumptions
Let’s take a look at why forward-looking returns makes sense. Returns are a byproduct of fundamentals for an asset class, valuation levels, and investor sentiment. Markets in the short-term act like “voting machines” based on the current news cycle and sentiment of investors. These returns are often disconnected with underlying fundamentals and valuation levels. However, over the long-term, markets behave like “balance scales,” weighing current prices relative to fundamentals. Therefore, good market return assumptions should be based on long-term expectations.

Fixed Income As An Example
A review of the fixed income market in 2019 illustrates just how extreme the difference between forward-looking return expectations vs. historical returns can be. One of the primary determinants of fixed income total return (price appreciation or depreciation plus i.e., bond yield) is the overall level of interest rates. There is a mathematical connection between the level and direction of interest rates and a bond’s price return. That is, as interest rates and bond yields go down, prices go up and vice versa.
In evaluating the historical level of interest rates in Exhibit 1, we see that the returns on bonds over the past forty years have been driven by declining interest rates (i.e., increasing bond price returns).
Inflation also has an important role in determining longer-term bond returns, in that higher inflation often forces higher interest rates. With market views that inflation may remain low, then future bond yields or total returns may not achieve historical averages any time soon.
Exhibit 1: Historical Interest Rate Levels Suggest Challenging Environment Going Forward
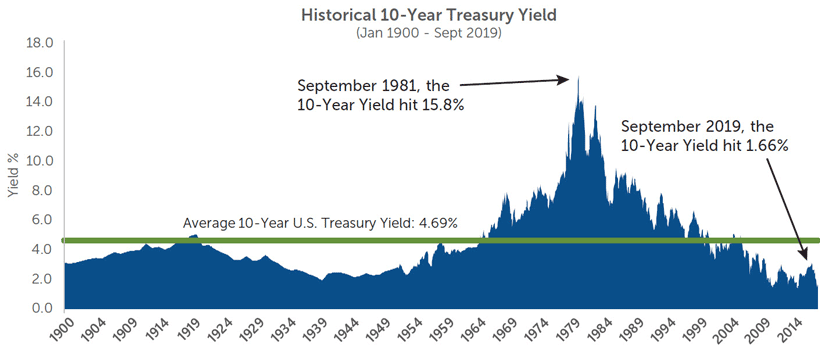
Source: Bloomberg, Mulpl.com
An evaluation of fundamentals and valuation levels suggests that future expected returns for the U.S. core fixed income is likely to be closer to 3.7% over the next ten years versus a historical average of 7.2%, representing a 3.5% lower annualized return difference – a 49% lower level.
When we evaluate the relevant drivers of long-term returns for domestic stocks we get a similar lower long-term return expectation. Our forward-looking capital market assumptions for large cap domestic equity stocks are approximately 6.7% over the next ten years versus a historical average of 9.2%. This is a 2.5% lower expected annualized return – a 27% lower level. This is not surprising given we are amidst the longest economic recovery and domestic equity bull market on record. However, we note the divergence between returns of domestic equity markets versus international developed and emerging markets over the last ten years, with the S&P 500 gaining an annualized 13.2% as of September 30, while the MSCI EAFE and EM indexes gained 4.9% and 3.4%, respectively. Based on different valuation levels and fundamentals, the expected returns of international developed and emerging market equities remain closer to their historical averages.
Exhibit 2: Forward-Looking Expectations vs Historical Averages
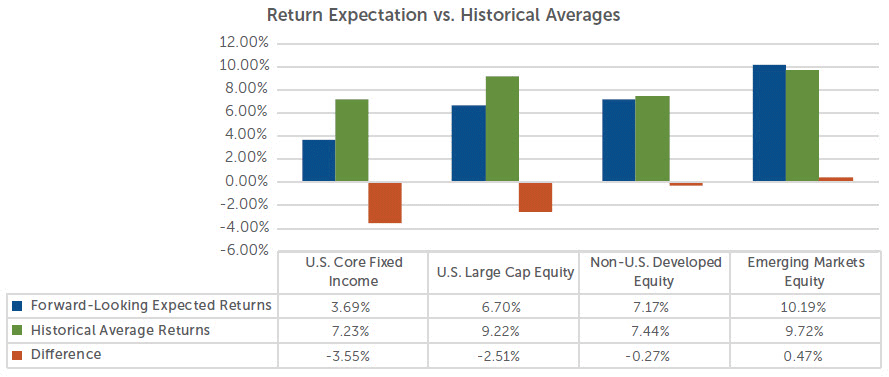
Note: Capital market assumptions are for illustration purposes and are based on CWM’s expected forward 10-year return expectations as of January 2019. These assumptions are revisited on an annual basis. Past performance if not indicative of future results. These assumptions should not be construed as a guarantee nor as a linear annual return. Capital markets returns vary significantly relative to either historical average or future expectations. Dates used for historical average returns ending December 2018: US Core Fixed Income: January 30th 1976; U.S. Large Cap Equity: December 31st 1929; Non-US Developed Equity: December 31st 1969; Emerging Markets: December 31st 1987.
Asset Allocation – A TECHNICAL OVERVIEW
Asset allocation involves diversifying investments across a variety of asset classes (e.g., stocks and bonds) to achieve a desired outcome with a higher degree of probability and a better risk-adjusted path. While many are familiar with the concept, the process and outcomes can vary greatly. For instance, some may think in rudimentary terms using the rule of thumb - you subtract your age from 100% to determine your equity exposure. On the other hand, a more prudent approach would be to actually study the inputs that go into scientifically modeling a desired outcome. The best approach to asset allocation should be a combination of art and science.
Inputs
One way to approach the “science” part of asset allocation, is through mean variance optimization, which calculates a set of optimal portfolios for any given level of risk (i.e., an efficient frontier), using three components for each asset class: a) mean return assumption, b) standard deviation, and c) correlations.
- Mean Return Assumptions – Many firms tend to simply use historical returns for each asset class being considered. This rear-view mirror approach does not factor in the current environment or the cause and effect relationships of valuation levels, fundamentals, and sentiment, particularly as it relates to the economic, political, monetary, and fiscal environment. We believe that the return inputs should include these and other factors in order to determine a more prudent forward-looking return assumption.
- Standard Deviation – Returns for asset classes will vary from period to period around the mean return assumption. As such, it is important to factor in the volatility of the returns around the assumption being used. This is quantified through standard deviation; a risk metric. While history shows that the actual return from period to period will vary, there is a higher level of consistency in longer term volatility for each asset class. Therefore, we believe that utilizing historically based standard deviation is prudent.
- Correlations – The third key ingredient needed to calculate the benefits of diversifying across various asset classes is the correlation of each asset class relative to one another. Good diversification would involve combining multiple asset classes that perform differently in various environments. Correlations are generally consistent over longer periods of time, so using historical correlations is prudent for the scientific part of asset allocation. Considering variances in how assets may correlate going forward can be addressed during the implementation phase of asset allocation.
Actual Inputs - Our asset allocation methodology is forward-looking; utilizing a ”building block” methodology to develop 10-year expected returns for various asset classes. For example, the U.S. Large Cap Equity expectation mentioned above is a combination of dividend yield, expected real earnings growth, and inflation expectations.
Asset Allocation Mixes
The actual mathematical process of determining the amount in each asset class begs the question of which asset classes to consider? This decision may include considerations for the level of correlation of one asset class to another, the risk-adjusted profile of each asset class, as well as accessibility to the asset class and the ability to implement it in client accounts. For example, domestic large cap growth and large cap value stocks have a very high correlation to more broadly defined large cap stocks. Therefore, using one capital market assumption for U.S. Large Cap Equity is sufficient. Allocating between growth and value can be addressed tactically during actual portfolio implementation.
Capital Market Assumptions
Exhibit 3 shows a hypothetical illustration of the various differences in expected returns and historical risk or volatility (i.e. standard deviation). This exhibit is provided for illustrative purposes only.
Exhibit 3: Capital Market Assumptions
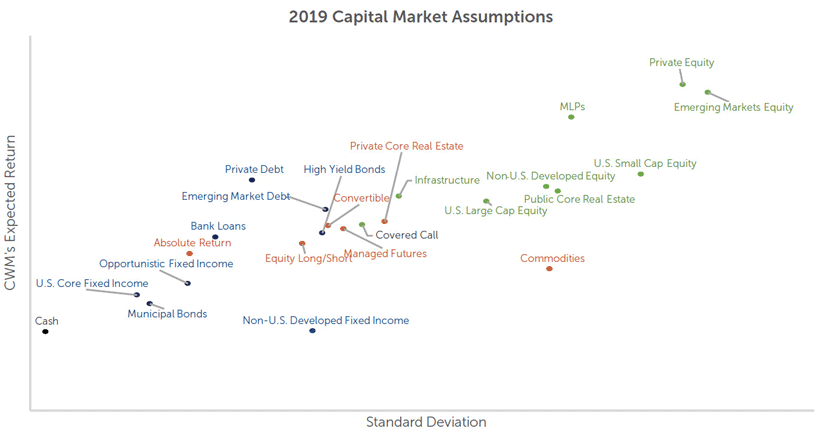
Source: Calamos Wealth Management Cash: Citi 3-Month Treasury bill; U.S. Core Fixed Income: Barclays U.S. Aggregate; Municipal Bonds: Barclays Intermediate Municipal 5-10 Year; Opportunistic Fixed Income: Barclays Universal Bond Index; Absolute Return: HFRI Blended Absolute Return; Bank Loans: Credit Suisse Leveraged Loan; Private Debt: Blended Private Debt Index – 40% Barclays HY, 40% Cliffwater Direct Lending & 20% Credit Suisse Leveraged Loan Index; Non-US. Developed Fixed Income: Citi WGBO NonUSD; Equity Long / Short: HFRI Equity Hedge; High Yield Bonds: Barclays US Corp. High Yield; Convertible: ICE BofAML All U.S. Convertible; Emerging Market Debt: 50% JPM EMBI Global / 50% JPM GBI-EM Gbl Div; Managed Futures: Credit Suisse Managed Futures Liquid; Covered Call: CBOE S&P Buywrite BXM; Private Core Real Estate: NCREIF Property; Infrastructure: S&P Global Infrastructure; U.S. Large Cap Equity: S&P 500; Commodities: Bloomberg Commodity; Non-U.S. Developed Equity: MSCI EAFE, Public Core Real Estate: FTSE NAREIT All Equity REITs; U.S. Small Cap Equity: Wilshire U.S. Small Cap; MLPs: Alerian MLP; Private Equity: Cambridge U.S. Private Equity; Emerging Market Equity: MSCI EM
Sample Asset Allocation
One of the previously mentioned benefits of asset allocation is that one can potentially create a more efficient portfolio (i.e., higher returns and/or lower risk) through the benefits of diversification. The following efficient frontier analysis shows a comparison of hypothetical portfolios. The “baseline” efficient frontier would include common asset classes like stocks and bonds, while the “strategic” frontier includes other asset classes that have different risk-reward characteristics. As we can see in Exhibit 4, by adding in other asset classes we can potentially improve returns across the given level of risk.
Exhibit 4: Diversification Can Improve the Risk-Adjusted Return Experience
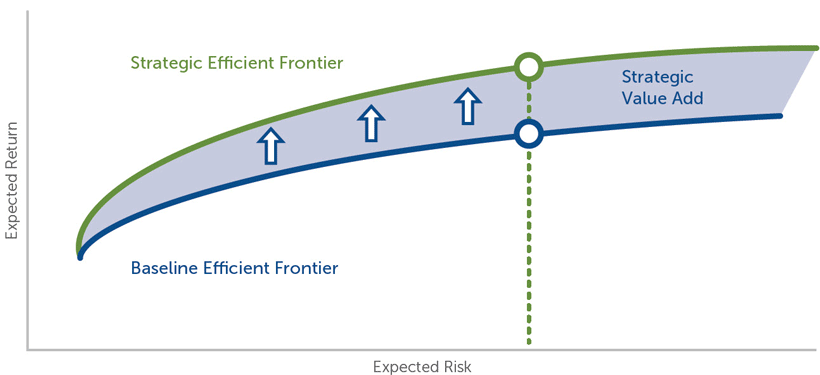
The efficient frontier analyses are hypothetical in nature and not guarantees of what will happen. The efficient frontier is a set of optimal asset allocations based on a given level of risk. Graphically, the efficient frontier is a line that portrays the most efficient tradeoff between risk and return. The efficient frontier is based upon a set of forward-projecting capital market assumptions including expected return and expected risk by asset class, as well as the expected correlations between all asset classes. The calculation will also consider restrictions or limitations by asset class. An example of such restrictions may be a minimum or maximum allocation to a specific asset class.
Conclusion
In closing, when contemplating asset allocation, we propose the following for investors to consider.
- Investment advisors should have a point of view on markets and how they can impact portfolios.
- Asset allocation decisions should be based on forward-looking market expectations for a variety of asset classes.
- Investment advisors should include these points of view in their actual financial and investment planning tools.
- Investment advisors should demonstrate to investors a variety of stress tests and scenario modeling of proposed allocations in order to set proper expectations. The analysis should be customized to the investor’s personal investment objectives and time horizon.
- Capital market assumptions and financial plans should be updated as an investor’s circumstances change and/or there are changes in the markets.
Past performance is not a guarantee or predictor of future results. Asset Allocation and Diversification does not guarantee a profit or protect against a loss.
Capital market assumptions may be revised periodically, which can severely alter the results of different analyses. Calamos Wealth Management cannot give any assurances that these assumptions or any results relying upon these assumptions will prove correct. This information is not intended as a recommendation to invest in any particular asset class or as a promise of future performance. References to future returns are not promises or even estimates of actual returns a client portfolio may achieve and should not be relied upon as recommendations to buy or sell securities. Assumptions, opinions and estimates are provided for illustrative purposes only. Forecasts of financial market trends that are based on current market conditions constitute our judgement and are subject to change without notice.
Different types of investments involve varying degrees of risk, and there can be no assurance that the future performance of any specific investment, investment strategy, or product (including the investments and/or investment strategies recommended or undertaken by Calamos Wealth Management, LLC), or any non-investment related content, made reference to directly or indirectly in this newsletter will be profitable, equal any corresponding indicated historical performance level(s), be suitable for your portfolio or individual situation, or prove successful. Due to various factors, including changing market conditions and/or applicable laws, the content may no longer be reflective of current opinions or positions. Moreover, you should not assume that any discussion or information contained in document serves as the receipt of, or as a substitute for, personalized investment advice from Calamos Wealth Management, LLC. To the extent that a reader has any questions regarding the applicability of any specific issue discussed above to his/her individual situation, he/she is encouraged to consult with the professional advisor of his/her choosing. Calamos Wealth Management, LLC is neither a law firm nor a certified public accounting firm and no portion of the content should be construed as legal or accounting advice. If you are a Calamos Wealth Management, LLC client, please remember to contact Calamos Wealth Management, LLC, in writing, if there are any changes in your personal/financial situation or investment objectives for the purpose of reviewing/evaluating/revising our previous recommendations and/or services. A copy of the Calamos Wealth Management, LLC’s current written disclosure statement discussing our advisory services and fees is available upon request.
Opinions and estimates offered constitute our judgment and are subject to change without notice, as are statements of financial market trends, which are based on current market conditions. We believe the information provided here is reliable, but do not warrant its accuracy or completeness. This material is not intended as an offer or solicitation for the purchase or sale of any financial instrument. The views and strategies described may not be suitable for all investors. The opinions and views of third parties do not represent the opinions or views of Calamos Wealth Management LLC. Opinions referenced are as of the date of publication and are subject to change due to changes in the market, economic conditions or changes in the legal and/or regulatory environment and may not necessarily come to pass. This information is provided for informational purposes only and should not be considered tax, legal, or investment advice. References to specific securities, asset classes and financial markets are for illustrative purposes only and are not intended to be, and should not be interpreted as, recommendations.
Past performance is no guarantee of future results.
Definitions:
Standard Deviation: The standard deviation is a statistic that measures the dispersion of a dataset relative to its mean and is calculated as the square root of the variance. It is calculated as the square root of variance by determining the variation between each data point relative to the mean. If the data points are further from the mean, there is a higher deviation within the data set; thus, the more spread out the data, the higher the standard deviation.
Correlation: Correlation, in the finance and investment industries, is a statistic that measures the degree to which two securities move in relation to each other.
Asset Class Definitions:
Cash:Cash and cash equivalents are investments with the highest level of liquidity and safety. Common types of cash and cash equivalents include Treasury Bills and money market funds.
U.S. Core Fixed Income:Fixed income investments generally pay a return on a fixed schedule, though the amount of the payments can vary. Individual bonds may be the best known type of fixed income security, but the category also includes bond funds, ETFs, CDs, and money market funds.
Municipal Bonds:A municipal bond is a debt security issued by a state, municipality or county to finance its capital expenditures, including the construction of highways, bridges or schools. They can be thought of as loans that investors make to local governments. Municipal bonds are exempt from federal taxes and most state and local taxes, making them especially attractive to people in high income tax brackets.
Opportunistic Fixed Income:Fixed income investments generally pay a return on a fixed schedule, though the amount of the payments can vary. Individual bonds may be the best known type of fixed income security, but the category also includes bond funds, ETFs, CDs, and money market funds. Open an Account.
Absolute Return:Absolute return investing describes a category of investment strategies and mutual funds that seek to earn a positive return over time—regardless of whether markets are going up, down, or sideways—and to do so with less volatility than stocks.
Bank Loans: The bank loan market – or “leveraged loan” market, as it is sometimes known – comprises debt from companies with below–investment grade credit ratings. Bank loans are typically secured with a lien on the company’s assets. They also generally rank senior to the company’s other debt and offer higher credit ratings, or less risk and more collateral backing, than unsecured bonds. Companies tap this market predominantly to fund mergers & acquisitions, leveraged buyouts or for general corporate purposes.
Private Debt:Private Debt consists of debt owed by companies that are generally illiquid and not traded on public exchanges and markets.
Non-US. Developed Fixed Income International Bonds are debt instruments issued by non-US government or corporations in their respective currency.
International bonds subject investors to the risk risks described under Fixed Income asset class definition. In addition, investors may be subject to political risk, currency risk, and liquidity risk. Political risk is a chance that investment returns are adversely affected as a result of political instability. Currency risk is the possibility that a change in currency price relative to another adversely affects investment returns. Liquidity risk is the chance that a sovereign entity may be unable to meet their financial obligation such as paying interest on a bond.
Equity Long / Short:Long/short equity is an investing strategy that takes long positions in stocks that are expected to appreciate and short positions in stocks that are expected to decline. A long/short equity strategy seeks to minimize market exposure while profiting from stock gains in the long positions, along with price declines in the short positions. Although this may not always be the case, the strategy should be profitable on a net basis.
High Yield Bonds:A high-yield bond is a high paying bond with a lower credit rating than investment-grade corporate bonds, Treasury bonds and municipal bonds. Because of the higher risk of default, these bonds pay a higher yield than investment grade bonds. Issuers of high-yield debt tend to be startup companies or capital-intensive firms with high debt ratios.
Convertibles:Convertibles securities are investments that can be changed into another form. The most common convertible securities are convertible bonds and convertible preferred stocks, which can be converted into a pre-determined quantity of the underlying company’s common stock. Convertibles securities subject investors to market risk, interest rate risk and credit risk. Market risk is the possibility that a security’s price will decline due to factors that affect the financial markets. Interest rate risk is the possibility that bond prices will decrease due to an increase in interest rates. Credit risk is the possibility that the issuing company defaults on its financial obligations including interested owed on bonds.
Emerging Market Debt: Emerging Market bonds are debt instruments issued by non-US government or corporations in their respective currency. International bonds subject investors to the risk risks described under Fixed Income asset class definition. In addition, investors may be subject to political risk, currency risk, and liquidity risk. Political risk is a chance that investment returns are adversely affected as a result of political instability. Currency risk is the possibility that a change in currency price relative to another adversely affects investment returns. Liquidity risk is the chance that a sovereign entity may be unable to meet their financial obligation such as paying interest on a bond.
Managed Futures: A type of alternative investments in the US in which trading in the futures markets is managed by another person or entity, rather than the fund's owner.[1] Managed futures accounts include, but are not limited to, commodity pools. These funds are operated by commodity trading advisors (CTAs) or commodity pool operators (CPOs), who are generally regulated in the United States by the Commodity Futures Trading Commission and the National Futures Association.
Covered Call:A covered call is a financial market transaction in which the seller of call options owns the corresponding amount of the underlying instrument, such as shares of a stock or other securities. If a trader buys the underlying instrument at the same time the trader sells the call, the strategy is often called a "buy-write" strategy. In equilibrium, the strategy has the same payoffs as writing a put option.
Private Core Real Estate:Real estate is property made up of land and the buildings on it, as well as the natural resources of the land including uncultivated flora and fauna, farmed crops and livestock, water, and any additional mineral deposits. Real Estate is not traded on a formal exchange or market. They are generally illiquid and may not be currently priced. The values and prices assigned to the investments are estimated, based on information typically received directly from the client.
Global Infrastructure: Infrastructure is the term for the basic physical systems of a business or nation—transportation, communication, sewage, water, and electric systems are all examples of infrastructure. These systems tend to be high-cost investments and are vital to a country's economic development and prosperity. Projects related to infrastructure improvements may be funded publicly, privately, or through public-private partnerships. In economic terms infrastructure often involves the production of public goods or production processes that support natural monopolies.
U.S. Large Cap Equity: Large cap (sometimes called "big cap") refers to a company with a market capitalization value of more than $10 billion. Large cap is a shortened version of the term "large market capitalization." Market capitalization is calculated by multiplying the number of a company's shares outstanding by its stock price per share. A company’s stock is generally classified as large cap, mid cap or small cap.
Commodities:A commodity is a basic good used in commerce that is interchangeable with other commodities of the same type. Commodities are most often used as inputs in the production of other goods or services. The quality of a given commodity may differ slightly, but it is essentially uniform across producers.When they are traded on an exchange, commodities must also meet specified minimum standards, also known as a basis grade. They tend to change rapidly from year to year.
Non-U.S. Developed Equity: International equities or international stocks are securities representing ownership of non-US company whose country is classified as a developed within the MSCI World Index. Foreign investing involves certain risks not typically associated with US domiciled investments, such as currency fluctuations, less government regulation and supervision, less liquidity and the potential for greater market volatility and political instability.
Public Core Real Estate: Real estate is property made up of land and the buildings on it, as well as the natural resources of the land including uncultivated flora and fauna, farmed crops and livestock, water, and any additional mineral deposits. Real Estate is not traded on a formal exchange or market. They are generally illiquid and may not be currently priced. The values and prices assigned to the investments are estimated, based on information typically received directly from the client.
U.S. Small Cap Equity:A small cap is generally a company with a market capitalization of between $300 million and $2 billion. The advantage of investing in small cap stocks is the opportunity to beat institutional investors. Small cap stocks have historically outperformed large cap stocks.
MLPs: Master limited partnerships (MLPs) are a business venture that exists in the form of a publicly traded limited partnerships. They combine the tax benefits of a private partnership—profits are taxed only when investors receive distributions—with the liquidity of a publicly-traded company (PTP).A master limited partnership trades on national exchanges. MLPs are situated to take advantage of cash flow, as they are required to distribute all available cash to investors. They can also help reduce the cost of capital in capital-intensive businesses, such as the energy sector.
Private Equity: Private equity is an alternative investments class and consists of capital that is not listed on a public exchange. Private equity is composed of funds and investors that directly invest in private companies, or that engage in buyouts of public companies, resulting in the delisting of public equity. Institutional and retail investors provide the capital for private equity, and the capital can be utilized to fund new technology, make acquistions, expand working capital, and to bolster and solidify a balance sheet.
Emerging Market Equity:Emerging Market Equity consists of stocks issued by companies of non-US countries classified as either ‘emerging market’ or ‘frontier markets’ within the MSCI World Index or the MSCI Frontier Markets Index. In addition to the general risk of foreign investing, the securities markets of Emerging Markets are substantially smaller, less developed, less liquid, and more volatile than the securities of US and other more developed countries.
Index Definitions:
Citi 3-Month Treasury bill: This index measures monthly return equivalents of yield averages that are not marked to market. The Three-Month Treasury Bill Indexes consist of the last three three-month Treasury bill issues.
Barclays U.S. Aggregate: A fixed income index comprised of investment grade corporate bonds, US Treasury securities, mortgage-backed securities, foreign bonds and government agency bonds with a remaining maturity of at least one year.
Intermediate Municipal 5-10 Year: The index measures the performance of municipal bonds with time to maturity of more than five years and less than ten years.
Barclays Universal Bond Index:The index measures the performance of U.S. dollar-denominated taxable bonds that are rated either investment-grade or high yield. The index includes U.S. Treasury bonds, investment-grade and high yield U.S. corporate bonds, mortgage-backed securities, and Eurodollar bonds.
HFRI Blended Absolute Return: 25% Relative Value is a global, equal-weighted index of the largest hedge funds that report to the HFR Database which are open to new investments and offer quarterly liquidity or better. The Relative Value funds that comprise the index are a subset of the HFRI 500 Fund Weighted Composite Index.; 25% Convertible Arbitrage includes strategies in which the investment thesis is predicated on realization of a spread between related instruments in which one or multiple components of the spread is a convertible fixed income instrument. Strategies employ an investment process designed to isolate attractive opportunities between the price of a convertible security and the price of a nonconvertible security, typically of the same issuer. Convertible arbitrage positions maintain characteristic sensitivities to credit quality the issuer, implied and realized volatility of the underlying instruments, levels of interest rates and the valuation of the issuer's equity, among other more general market and idiosyncratic sensitivities. 25% Merger Arbitrage strategies which employ an investment process primarily focused on opportunities in equity and equity related instruments of companies which are currently engaged in a corporate transaction. Merger Arbitrage involves primarily announced transactions, typically with limited or no exposure to situations which pre-, post-date or situations in which no formal announcement is expected to occur. Opportunities are frequently presented in cross border, collared and international transactions which incorporate multiple geographic regulatory institutions, with typically involve minimal exposure to corporate credits. Merger arbitrage strategies typically have over 75% of positions in announced transactions over a given market cycle. 25% Event Driven: Investment Managers who maintain positions in companies currently or prospectively involved in corporate transactions of a wide variety including but not limited to mergers, restructurings, financial distress, tender offers, shareholder buybacks, debt exchanges, security issuance or other capital structure adjustments. Security types can range from most senior in the capital structure to most junior or subordinated, and frequently involve additional derivative securities. Event Driven exposure includes a combination of sensitivities to equity markets, credit markets and idiosyncratic, company specific developments. Investment theses are typically predicated on fundamental characteristics (as opposed to quantitative), with the realization of the thesis predicated on a specific development exogenous to the existing capital structure.
Credit Suisse Leveraged LoanThis index tracks the investable market of the U.S. dollar denominated leveraged loan market. It consists of issues rated “5B” or lower, meaning that the highest rated issues included in this index are Moody's/S&P ratings of Baa1/BB+ or Ba1/BBB+
Blended Private Debt Index40% Barclays HY (Barclays US High Yield Very Liquid Index (VLI) is a component of the US Corporate High Yield Index that is designed to track a more liquid component of the USD-denominated, high yield, fixed-rate corporate bond market: 40% Cliff water Direct (The Cliffwater Direct Lending Index (CDLI) seeks to measure the unlevered, gross of fee performance of U.S. middle market corporate loans, as represented by the asset-weighted performance of the underlying assets of Business Development Companies (BDCs), including both exchange-traded and unlisted BDCs, subject to certain eligibility requirements. The CDLI Total Return Index includes three components: Income Return, Realized Gain/Loss, and Unrealized Gain/Loss.& 20% Credit Suisse Leveraged Loan Index (This index tracks the investable market of the U.S. dollar denominated leveraged loan market. It consists of issues rated “5B” or lower, meaning that the highest rated issues included in this index are Moody's/S&P ratings of Baa1/BB+ or Ba1/BBB+: Private Debt consists of debt owed by companies that are generally illiquid and not traded on public exchanges and markets.
Citi WGBO NonUSD; The index measures the performance of government bonds issued by governments outside the U.S.
HFRI Equity Hedge;Investment Managers who maintain positions both long and short in primarily equity and equity derivative securities. A wide variety of investment processes can be employed to arrive at an investment decision, including both quantitative and fundamental techniques; strategies can be broadly diversified or narrowly focused on specific sectors and can range broadly in terms of levels of net exposure, leverage employed, holding period, concentrations of market capitalizations and valuation ranges of typical portfolios. EH managers would typically maintain at least 50% exposure to, and may in some cases be entirely invested in, equities, both long and short.
Barclays HYBarclays US High Yield Very Liquid Index (VLI) is a component of the US Corporate High Yield Index that is designed to track a more liquid component of the USD-denominated, high yield, fixed-rate corporate bond market
ICE BofAML All U.S. Convertible;The index consists of convertible bonds traded in the U.S. dollar denominated investment grade and non investment grade convertible securities sold into the U.S. market and publicly traded in the United States. The Index constituents are market value weighted based on the convertible securities prices and outstanding shares, and the underlying index is rebalanced daily.
Emerging Market Debt: 50% JPM EMBI Global: The index is an unmanaged, market-capitalization weighted, total-return index tracking the traded market for U.S.-dollar-denominated Brady bonds, Eurobonds, traded loans, and local market debt instruments issued by sovereign and quasi-sovereign entities. 50% JPM GBI-EM Gbl Div; indices are comprehensive emerging market debt benchmarks that track local currency bonds issued by Emerging market governments. The index was launched in June 2005 and is the first comprehensive global local Emerging Markets index. As Emerging Market governments look increasingly toward their domestic market for sources of finance, investors are looking more closely at local markets in search for higher yield and greater diversification.
Credit Suisse Managed Futures Liquid Index: Seeks to gain broad exposure to the Managed Futures strategy using a pre-defined quantitative methodology to invest in a range of asset classes including: equities, fixed income, commodities and currencies.
CBOE S&P Buywrite BXM:A benchmark index designed to track the performance of a hypothetical buy-write strategy on the S&P 500 Index.
NCREIF Property:A quarterly, unleveraged composite total return for private commercial real estate properties held for investment purposes only. All properties in the NPI have been acquired, at least in part, on behalf of tax-exempt institutional investors and held in a fiduciary environment.
S&P Global Infrastructure: Designed to track 75 companies from around the world chosen to represent the listed infrastructure industry while maintaining liquidity and tradability. To create diversified exposure, the index includes three distinct infrastructure clusters: energy, transportation, and utilities.
S&P 500: Widely regarded as the best single gauge of large-cap U.S. equities. There is over USD 9.9 trillion indexed or benchmarked to the index, with indexed assets comprising approximately USD 3.4 trillion of this total. The index includes 500 leading companies and covers approximately 80% of available market capitalization.
Bloomberg Commodity:Calculated on an excess return basis and reflects commodity futures price movements. The index rebalances annually weighted 2/3 by trading volume and 1/3 by world production and weight-caps are applied at the commodity, sector and group level for diversification. Roll period typically occurs from 6th-10th business day based on the roll schedule.
MSCI EAFE: Index that is designed to measure the equity market performance of developed markets outside of the U.S. & Canada. It is maintained by MSCI Inc., a provider of investment decision support tools; the EAFE acronym stands for Europe, Australasia and Far East.
FTSE NAREIT All Equity REITs: A free-float adjusted, market capitalization-weighted index of U.S. equity REITs. Constituents of the index include all tax-qualified REITs with more than 50 percent of total assets in qualifying real estate assets other than mortgages secured by real property.
Wilshire U.S. Small Cap: A benchmark of the small-sized value (based on) companies in the U.S. equity market. The Wilshire US Small-Cap Value is a float-adjusted, market capitalization-weighted derivative index of the Wilshire US Small-Cap IndexSM and by extension the Wilshire 5000 Total Market IndexSM (Wilshire 5000®). The Wilshire US Small-Cap is divided into growth and value by looking at six factors: projected price-to-earnings ratio, projected earnings growth, price-to-book ratio, dividend yield, trailing revenue growth and trailing earnings growth. The Wilshire US Small-Cap Value was introduced in 1996.
Alerian MLP: The leading gauge of energy infrastructure Master Limited Partnerships (MLPs). The capped, float-adjusted, capitalization-weighted index, whose constituents earn the majority of their cash flow from midstream activities involving energy commodities, is disseminated real-time on a price-return basis (AMZ) and on a total-return basis (AMZX).
Cambridge U.S. Private Equity: A horizon calculation based on data compiled from 1,468 US private equity funds (buyout, growth equity, private equity energy and subordinated capital funds), including fully liquidated partnerships, formed between 1986 and 2017.
MSCI EM: Captures large and mid cap representation across 26 Emerging Markets (EM) countries*. With 1,202 constituents, the index covers approximately 85% of the free float-adjusted market capitalization in each country. Emerging Market Equity consists of stocks issued by companies of non-US countries classified as either ‘emerging market’ or ‘frontier markets’ within the MSCI World Index or the MSCI Frontier Markets Index. In addition to the general risk of foreign investing, the securities markets of Emerging Markets are substantially smaller, less developed, less liquid, and more volatile than the securities of US and other more developed countries.